1 hour new system. Agnew method
Hi,
I would like to share with you all my new findings for trading the 1 hour chart
I have been trading the forex markets for over 5 years, I have tried lots of indicators and I am confident that what I have discovered will change how you view price action.
this has been developed to be used on the 1 hour time frame only, so no changing time frames please.
this is what the settings are as follows
233 sma is the bias line, above this is a buy below this is a sell
10 exponential moving average low shift 5 with -200 level
this is all you need.
I will try and upload a screenshot to let you see what I mean, I am having some problems with the up-loader right nowHi Jamesagnew,
The up-loading problem is a forum wide problem now, the developers have been contacted hoping to have it fixed soon, sorry for the inconveince.
for anyone who is interested, please leave your e-mail and I will send you the template and also the example of what to do, its a 2 step process, setting your initial stop loss take profit 1 is 1:1 then the take profit 2 at 2:1 , you will see what i mean when i send you the examples.
i am not sure how long this example will be up for
take a look at this
Uploads are working OK now, so that issue is solved
Happy trading 
Thank you very much, Mr James for this system. I follow your calls and appreciate your Moving Average settings. I followed your call when you were developing copy of the Forex Blackbook system and thanked you for that.
I have applied your new system to chart and can see the potential inherent in the system.
However, I observed that there could be false break out of the 10 EMA low and the -200 level.
Is there any filter you are considering to checkmate false breakouts like I observed one in your posted chart or are u saying that we should ignore any break out of 10 EMA as long as SMA 233 is as you specified on the set up?. If this is the case, how do we identify change in trend that will eventually breach the sma 233 indicator?
I hope u understand my point.
Thank you again.
Okoli
for anyone who is interested, please leave your e-mail and I will send you the template and also the example of what to do, its a 2 step process, setting your initial stop loss take profit 1 is 1:1 then the take profit 2 at 2:1 , you will see what i mean when i send you the examples.
i am not sure how long this example will be up for
take a look at thiscould you send me your setup, please?
the method explained
I have uploaded the template and the example below
here is the rules as follows
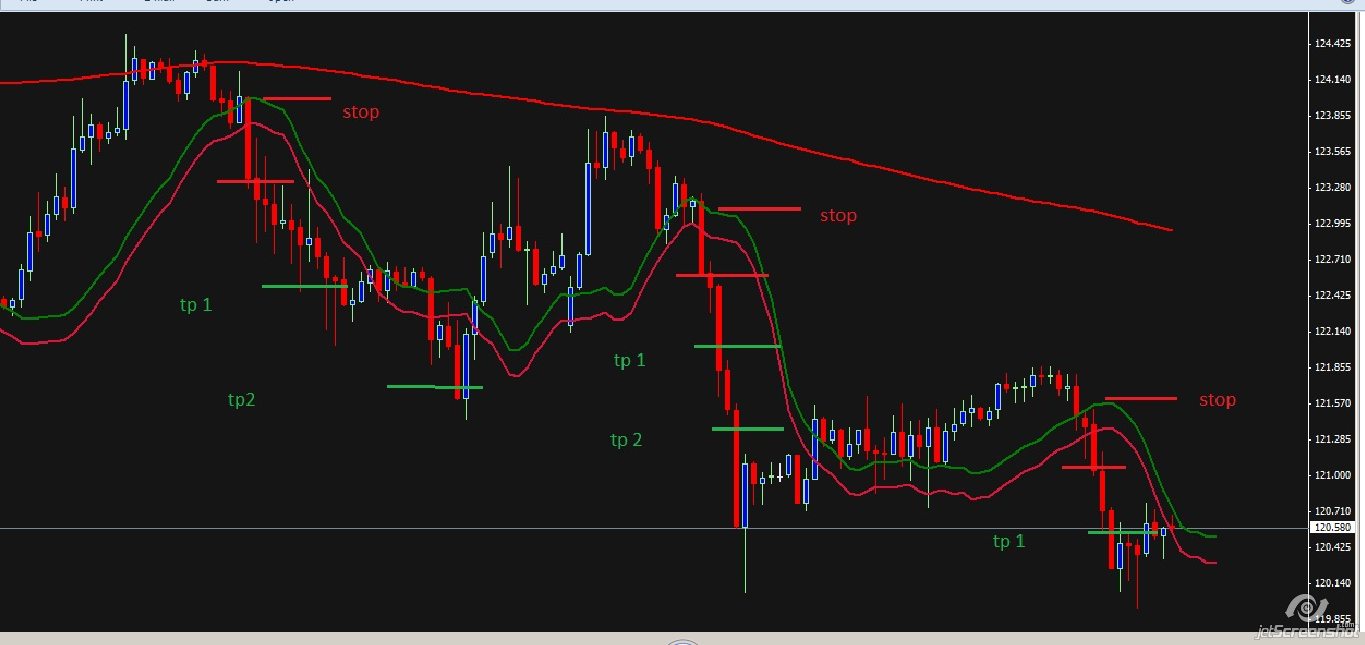
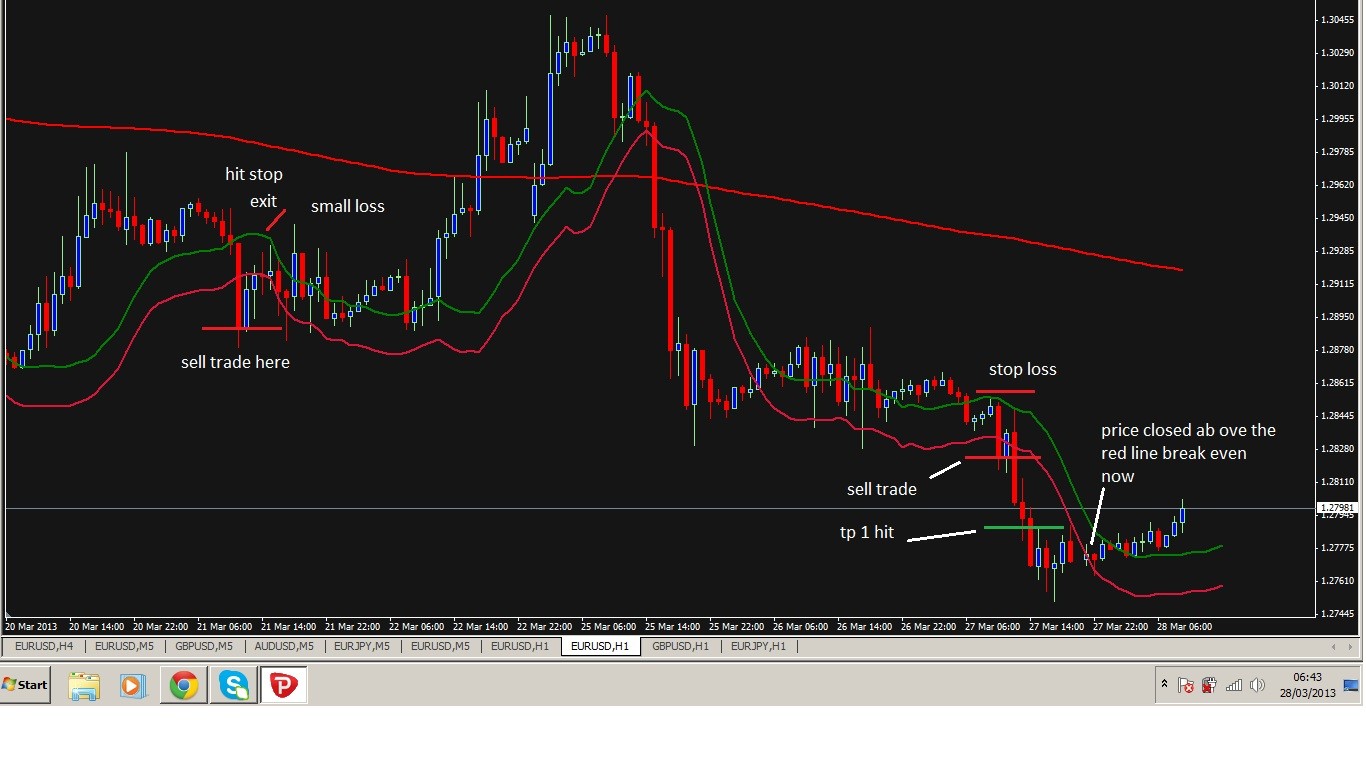
sell trade : we want to see the price under the 233 sma this is selling only, then we want to see that the price was above the price action channel then it closed under the red line, this is your sell entry , the stop loss is going to go above the top green line, you want to go for 1:1 then 2:1, you don't break even at 1:1, you only break even when the price has come back inside the price action channel area closed above the red line, the goal is to hit both your tp areas then to exit the trade
buy trade : we want to see the price above the 233 sma this is buying only, then we want to see that the price was below the price action channel then it closed above the green line. this is your buy entry, the stop is below the bottom red line, you want to go for 1:1 then 2:1. you dont break even at 1:1 , you only break even when the price has come back inside the price action channel area closed below green line, the goal is to hit both you to areas then to exit the trade
I hope you understand what I am saying here, take a look at the examples
Thank you very much, Mr James for this system. I follow your calls and appreciate your Moving Average settings. I followed your call when you were developing copy of the Forex Blackbook system and thanked you for that.
I have applied your new system to chart and can see the potential inherent in the system.
However, I observed that there could be false break out of the 10 EMA low and the -200 level.
Is there any filter you are considering to checkmate false breakouts like I observed one in your posted chart or are u saying that we should ignore any break out of 10 EMA as long as SMA 233 is as you specified on the set up?. If this is the case, how do we identify change in trend that will eventually breach the sma 233 indicator?
I hope u understand my point.
Thank you again.
Okolino system is 100 % holy grail
this is a good method in my opinion for growing your account with discipline, Forex trading is a business , you need to approach it like this, its not a casino sorry,
you will not always win but as long as your winners outrun your losers you will be OK,
I am sick of all the false promises that forex his given to me that it drove me to create this method for those who are sick and tired of all the madness thats going on in the forex market right now,
just use this method and be happy win or loss, stick to this method and stop looking for holy grail its just not going to happen.
I wish you success in your trading

examples
here is another example trade for you to see
you can see that price may hit your targets 1 and 2 just fine, other times it may hit only target 1 then it will give signs of weakness that may indicate a turning area, other times it will hit your take profit 1 and 2 areas and keep going, but do not be thinking to yourself why did i exit when it is still going , we can not read the future only prepare for it
have a look and you will see what I mean
- Free trading apps
- Over 8,000 signals for copying
- Economic news for exploring financial markets
You agree to website policy and terms of use
Hi,
I would like to share with you all my new findings for trading the 1 hour chart
I have been trading the forex markets for over 5 years, I have tried lots of indicators and I am confident that what I have discovered will change how you view price action.
this has been developed to be used on the 1 hour time frame only, so no changing time frames please.
this is what the settings are as follows
233 sma is the bias line, above this is a buy below this is a sell
10 exponential moving average low shift 5 with -200 level
this is all you need.
I will try and upload a screenshot to let you see what I mean, I am having some problems with the up-loader right now