Ergodic TSI histogram for MT4 - Anyone can convert this indicator into MT4? code here
Guys,
Anyone can convert this TRADINGVIEW indicator into MT4 please in historgram (bars) version?
////////////////////////////////////////////////////////////
// Copyright by HPotter v1.0 17/07/2014
// r - Length of first EMA smoothing of 1 day momentum 4
// s - Length of second EMA smoothing of 1 day smoothing 8
// u- Length of third EMA smoothing of 1 day momentum 6
// Length of EMA signal line 3
// Source of Ergotic TSI Close
//
// This is one of the techniques described by William Blau in his book "Momentum,
// Direction and Divergence" (1995). If you like to learn more, we advise you to
// read this book. His book focuses on three key aspects of trading: momentum,
// direction and divergence. Blau, who was an electrical engineer before becoming
// a trader, thoroughly examines the relationship between price and momentum in
// step-by-step examples. From this grounding, he then looks at the deficiencies
// in other oscillators and introduces some innovative techniques, including a
// fresh twist on Stochastics. On directional issues, he analyzes the intricacies
// of ADX and offers a unique approach to help define trending and non-trending periods.
// You can use in the xPrice any series: Open, High, Low, Close, HL2, HLC3, OHLC4 and ect...
////////////////////////////////////////////////////////////
study(title="Ergotic TSI")
r = input(4, minval=1)
s = input(8, minval=1)
u = input(6, minval=1)
SmthLen = input(3, minval=1)
hline(0, color=blue, linestyle=line)
xPrice = close
xPrice1 = xPrice - xPrice[1]
xPrice2 = abs(xPrice - xPrice[1])
xSMA_R = ema(ema(ema(xPrice1,r), s),u)
xSMA_aR = ema(ema(ema(xPrice2, r), s),u)
Val1 = 100 * xSMA_R
Val2 = xSMA_aR
xTSI = iff (Val2 != 0, Val1 / Val2, 0)
xEMA_TSI = ema(xTSI, SmthLen)
plot(xTSI, color=green, title="Ergotic TSI")
plot(xEMA_TSI, color=red, title="SigLin")
////////////////////////////////////////////////////////////
Would highly appreciate!
Thanks!!!rommark2
Check this thread : https://www.mql5.com/en/forum/173131
Hey Mladen,
Thanks a lot, but which one of them i can actually make look like this:
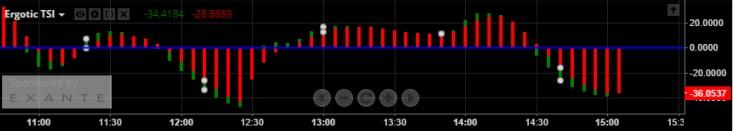
From those i tested, i could not find one that allowed me to look the crosses like this one in tradingview.
Thanks so much!
Hey Mladen,
Thanks a lot, but which one of them i can actually make look like this:
From those i tested, i could not find one that allowed me to look the crosses like this one in tradingview.
Thanks so much!rommark2
The red part is not a TSI. It is a signal line that us added by the coder of that version (signal line does not exist in the original TSI by William Blau and that is the cause for difference). The real TSI on your picture is the one that is drawn in red color
Hey Mladen,
By any chance you could help adding this part into MT4 version too?
Thank you so much!
- Free trading apps
- Over 8,000 signals for copying
- Economic news for exploring financial markets
You agree to website policy and terms of use
Guys,
Anyone can convert this TRADINGVIEW indicator into MT4 please in historgram (bars) version?
////////////////////////////////////////////////////////////
// Copyright by HPotter v1.0 17/07/2014
// r - Length of first EMA smoothing of 1 day momentum 4
// s - Length of second EMA smoothing of 1 day smoothing 8
// u- Length of third EMA smoothing of 1 day momentum 6
// Length of EMA signal line 3
// Source of Ergotic TSI Close
//
// This is one of the techniques described by William Blau in his book "Momentum,
// Direction and Divergence" (1995). If you like to learn more, we advise you to
// read this book. His book focuses on three key aspects of trading: momentum,
// direction and divergence. Blau, who was an electrical engineer before becoming
// a trader, thoroughly examines the relationship between price and momentum in
// step-by-step examples. From this grounding, he then looks at the deficiencies
// in other oscillators and introduces some innovative techniques, including a
// fresh twist on Stochastics. On directional issues, he analyzes the intricacies
// of ADX and offers a unique approach to help define trending and non-trending periods.
// You can use in the xPrice any series: Open, High, Low, Close, HL2, HLC3, OHLC4 and ect...
////////////////////////////////////////////////////////////
study(title="Ergotic TSI")
r = input(4, minval=1)
s = input(8, minval=1)
u = input(6, minval=1)
SmthLen = input(3, minval=1)
hline(0, color=blue, linestyle=line)
xPrice = close
xPrice1 = xPrice - xPrice[1]
xPrice2 = abs(xPrice - xPrice[1])
xSMA_R = ema(ema(ema(xPrice1,r), s),u)
xSMA_aR = ema(ema(ema(xPrice2, r), s),u)
Val1 = 100 * xSMA_R
Val2 = xSMA_aR
xTSI = iff (Val2 != 0, Val1 / Val2, 0)
xEMA_TSI = ema(xTSI, SmthLen)
plot(xTSI, color=green, title="Ergotic TSI")
plot(xEMA_TSI, color=red, title="SigLin")
////////////////////////////////////////////////////////////
Would highly appreciate!
Thanks!!!