Trading using two pivot levels
Good post. Thanks 
Trading using two pivot levels
Caracteristics
Both upside and downside bias implies potential ferm or even aggressive moves which could lead to fresh historical lows, when positioning in the downside bias or to go to fresh highs, when the price is positioning in the downside bias.
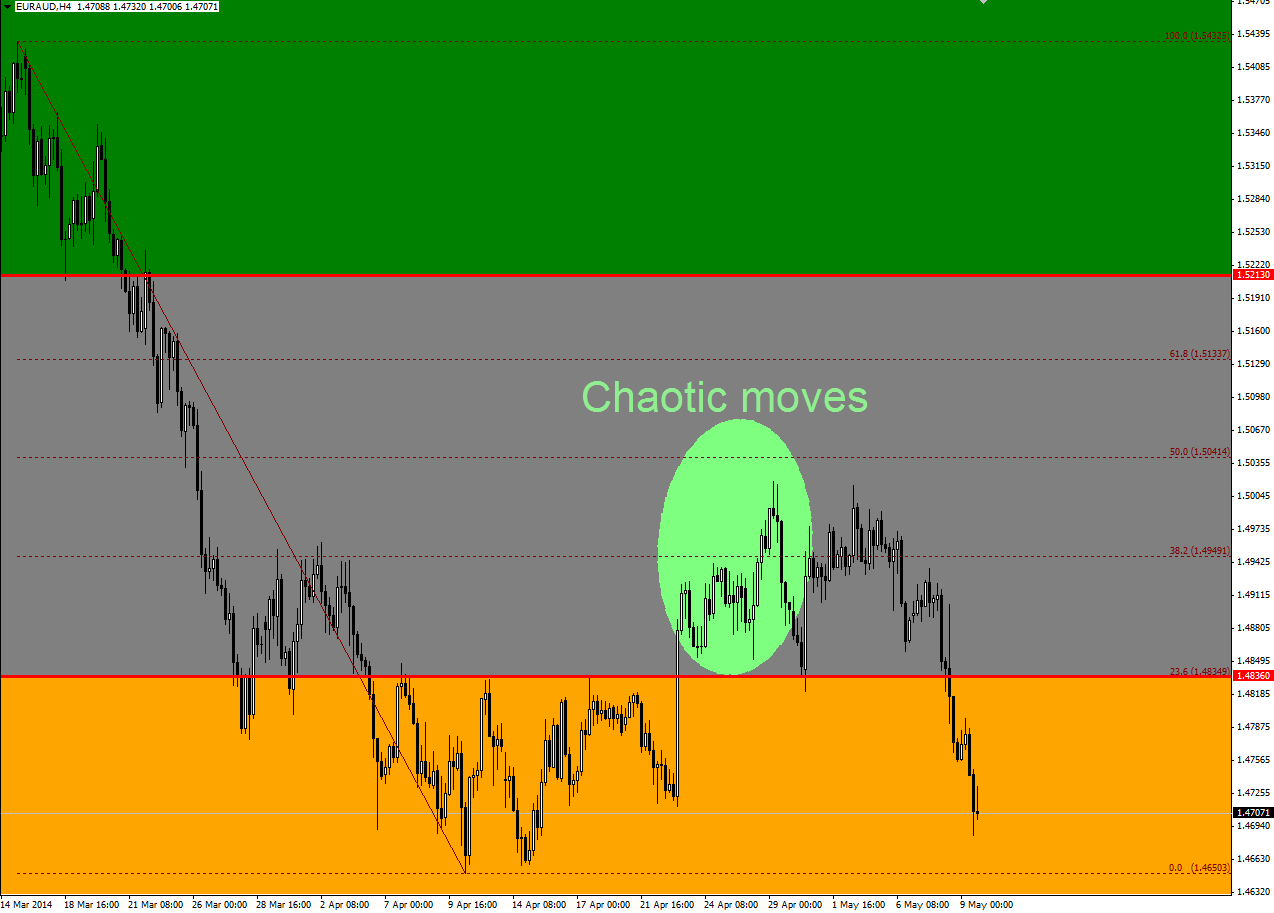
When the price break any pivot level and enters in the neutral bias, this action should be watched with caution, because the positioning in this particular case may entail with losses, because the price could correct very little, or to be a fake break or even the nature of the correction to be iregular and chaotic.
Just watch below the reaction of the EUR/AUD currency pair, when broke the 1.4848 pivot level. Up and downs like a spinner.
Among the advantages, trading only the upside and downside biases, are:
- there is higher degree of the certanty, regarding hitting the targets
- there is a little more room of stop-losses, and the price can breath and consolidate before bursting into an impulsive trend move
- there are better risk ratio in the upside and downside biases cases than in the neutral
Upside bias on EUR/AUD

This movement occur when the global central banks cut interest rates simultaneously.
Downside bias on Nasdaq
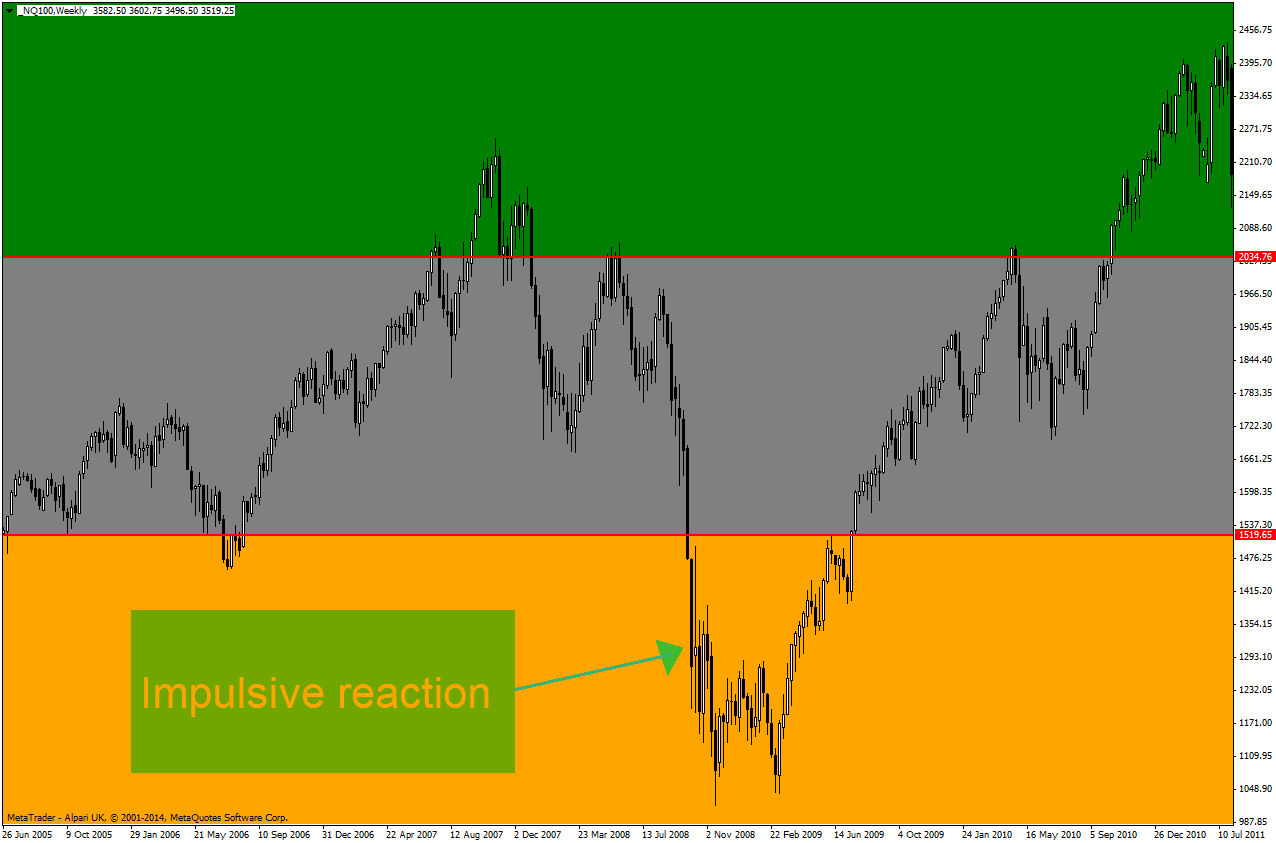
An this move happened when after Lehman Brothers event.
Trading using two pivot levels
Planning and execution
Targets and stop-losses
Now, for the upside and downside biases the T/P's and S/L's will be as follows:
Upside bias
If the price confirms the entry in this area, we'll enter buy having the target the last high, like the EUR/USD example, last friday, before the big collapse.
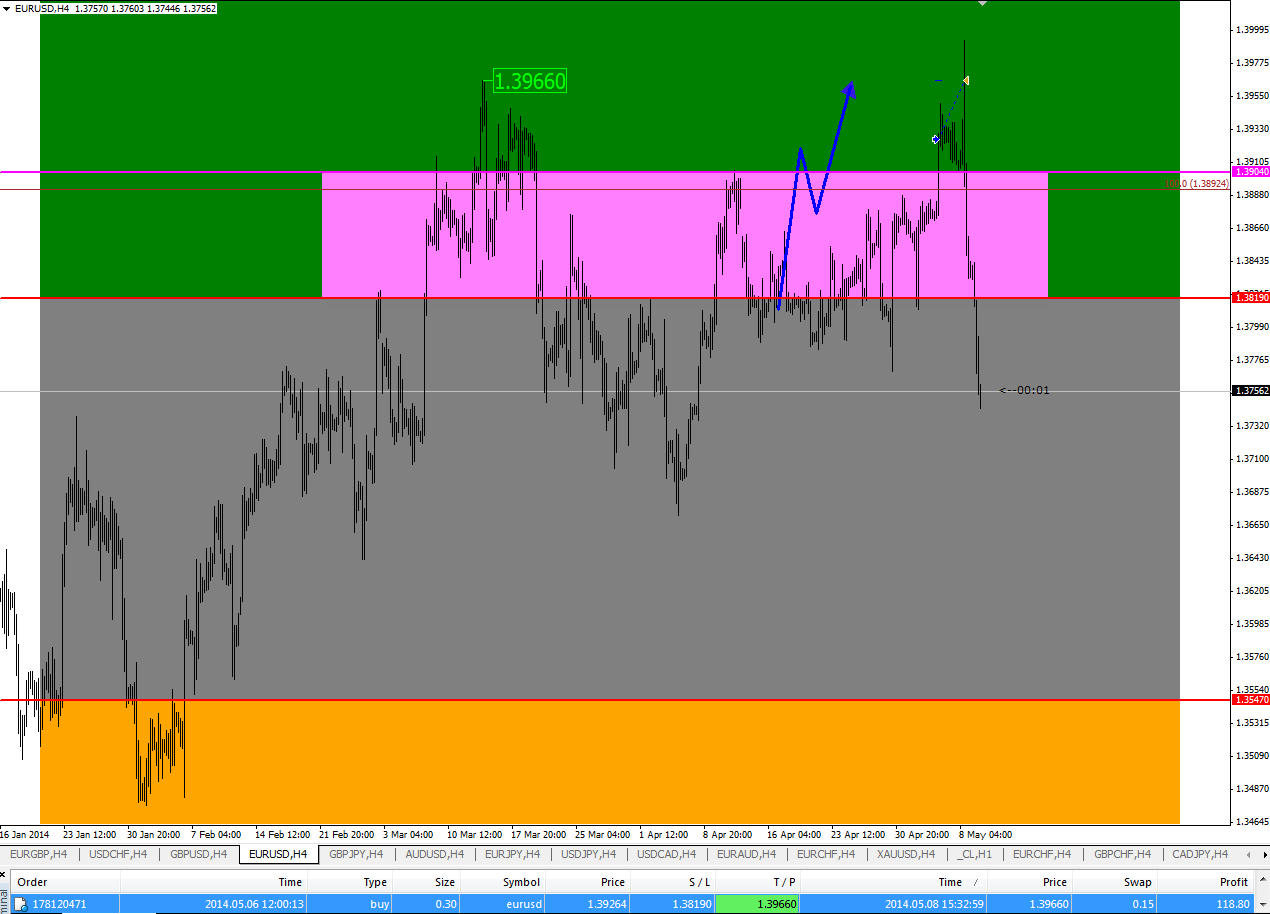
Exception: if the price it's to close of it's target, let's say under 10 pips, the target will be 127.2 Fibonacci extension.
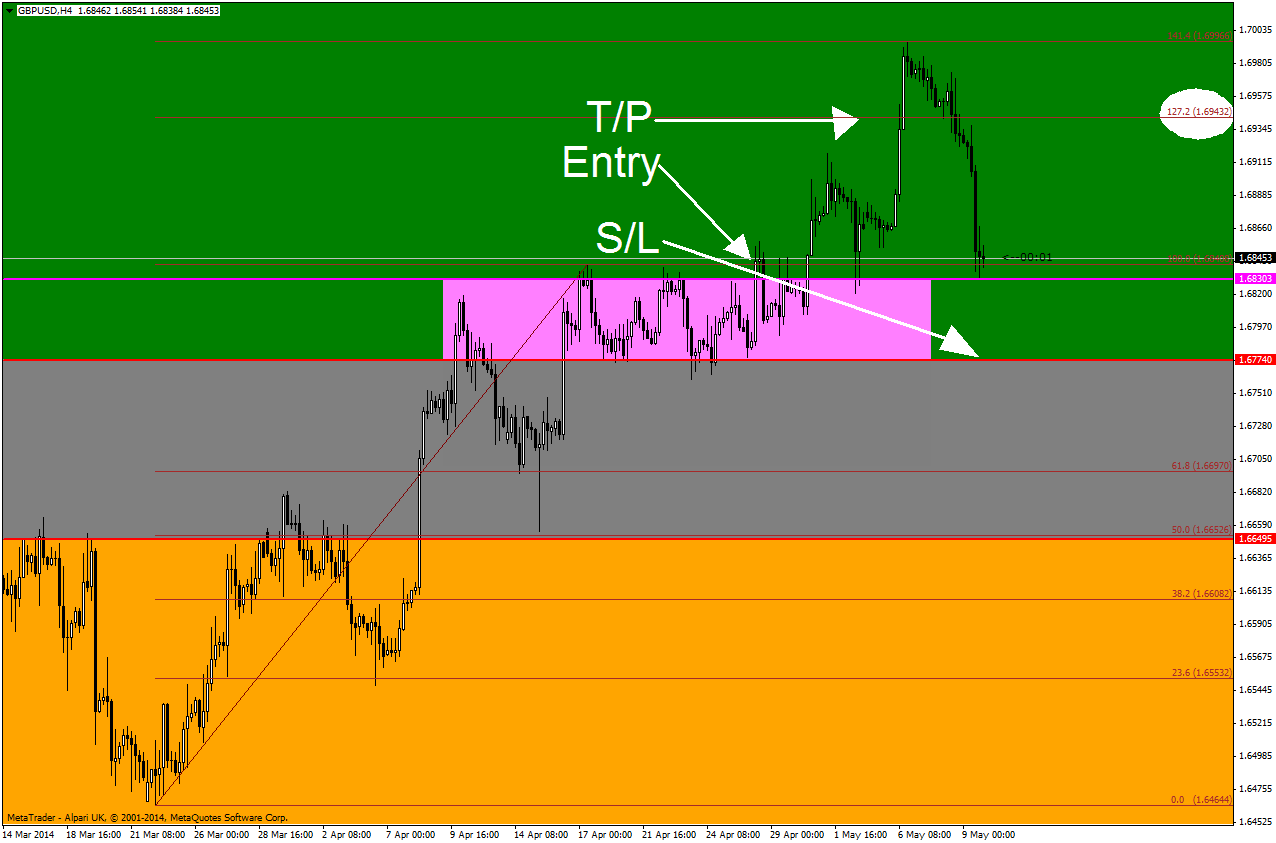
The same for downside bias, the last visible low and the 127.2 Fibonacci extension.
The missing piece
To be honest, the execution of this trading style was always a big problem. Because I used to enter short or long whenever the price entered into one bias zone or another, without any other confirmation, and that wasn't the proper way of approach.
At the beginning, I've been observing that the trades I took based on the price entering the neutral bias zone weren't that accurate as I've expected. A lot of stop-losses taken, some closed on limit and then the innitial move has continued - in on word - FRUSTRATING. Then, when the appearance of the other two situations (for upside and downside biases), I had a real problem, a finesse one and I had to take a major decission: that I need something more to the trading system- A SOLID CONFIRMATION!
I needed an extra level or zone, by whose violation, the trade taken should have a better chance of survival in these strange market conditions.
I'll put an example bellow, the AUD/CAD pair.
As you can see the pair broke 0.9736 pivot level, positioning itself in the upside bias.
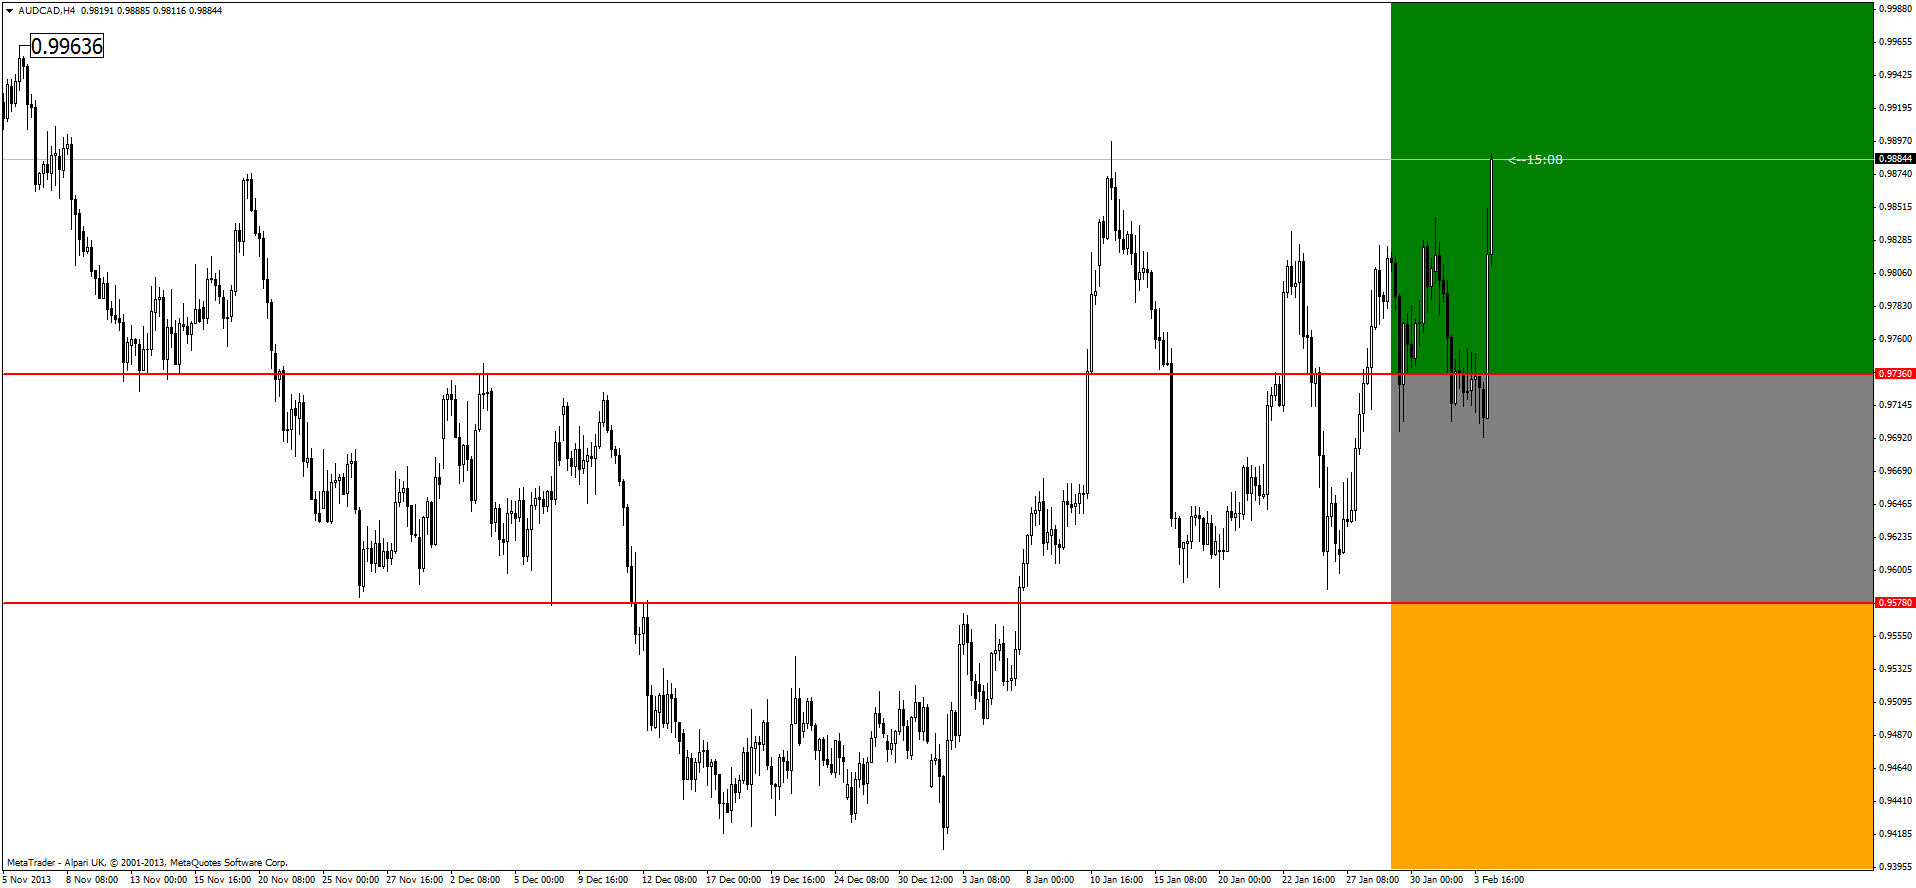
The trouble was in this example, and that was a real trade situation, evert time the price has entered the upside bias, then came back into neutral bias, over and over again. The sum of the losses only for this case was nearly one hundred pips - it was a waste for nothing.

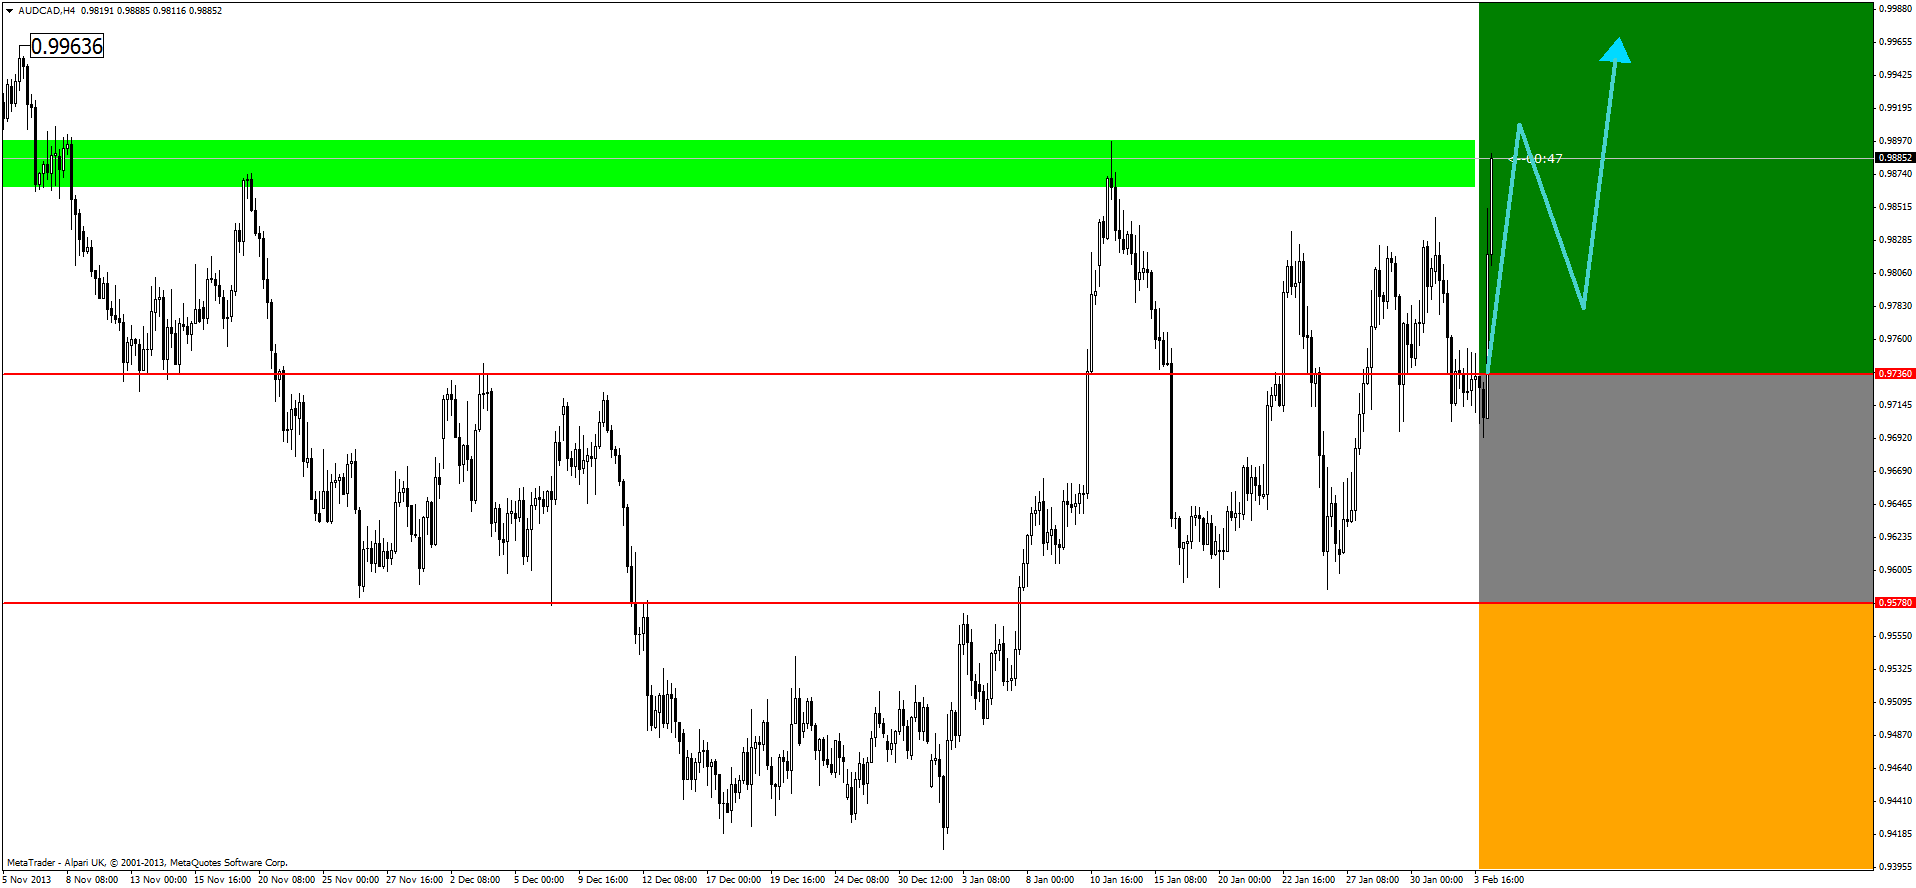
And after that I've decided that, an extra zone, a confirmation zone (yeah, it kind of rips the title of this topic) on which breaking would give a greater degree for the safety of the trade, as much time as possible, so the potential up or down move to develop as we wish.
Trading using two pivot levels
Forex: AUD/USD, short term outlook and trade setup
The currency pair changed it's bias, on the 6th of May, from neutral to upside, by broking the 0.9292 pivot level. Since then, has managed to confirm the much anticipated up move by closing over the 0.9384 (only by one pip). I expect the innitial upside movement to continue even further for targeting the 0.94599 (100.5 pips). The stop loss is placed on the pivot level which sepparates the upside from neutral biases, on 0.9292 level (67.4 pips).

I am reading this, and I have a question : am I correct that the two pivot levels are determined manually (using our experience as a criteria)?
Yes, they are drawn manually and an indicator put colores and that's how it takes shapes the three zones, that's all. Yes, you are wright about experience. Meanwhile, you can watch me drawing them and learn how and then you can practice on your own and put them here. We'll discuss about them, when it needed.
Saw your trade explorer on FxFactory and your return doesn't look good
Saw your trade explorer on FxFactory and your return doesn't look good
Not good or NOT GOOD?
i have a question?
does the pivot levels come from the pivot point?
or is the pivot levels related to the pivot point?
i know how to calculate the pivot point. but how to calculate the pivot levels?
Not good or NOT GOOD?
NOT good .
- Free trading apps
- Over 8,000 signals for copying
- Economic news for exploring financial markets
You agree to website policy and terms of use
Introduction
In this topic we'll discuss about a trading system which involves trading using only two pivot levels.
But first, let's define them.
As you already may know, the pivot levels are those support and resistance leves which, according with the variation of the price - they switch from a category to another. (example: the transition from a support level to a resistance level).
As an example I took randomly a Gold chart, on daily time frame, it's not important wich time frame do you use and we can see how on three different ocassions, the precious metal tried to push over the 993.00 level, where the resistance level was situated. At this point the level was strong but soon after that the price tried to break it once again and succeeded, and that level was used as a point of leverage for the upside movement which was nesting, the 993.00 level became then a pivot level.
Conclusion: a support which becomes resistance (or vice versa) is a pivot level.
Always, there was an important problem regarding the positioning of the price into a category which is called: range or sidedays and when the price strive to move from one direction to another, into a constant limited range.
Trading using two pivot levels coming in solving this dilemma.
Construction
For starters, you need to determine (on any given chart) the two most important pivot levels. We need to built only two horizontal lines for that. The ultimate goal of this is to have a system which define for you in a very precise manner if there is trend or not or future warnings regarding the possible shifting in trend or a entry into a possible messy correction phase or sideways market.
In the example below, on the AUD/CHF pair, we established two pivotal values on the 0.9850 level and respectively - 0.9473 level.
To do that you don't have to zoom out too much into the past price action, I did it in the upper example only to highlight and make you understand properly these areas and you need to do that when the price action is lacking it's clarity or there exists relevant support and resistance areas, for marking.But these situations are rare.
Now, after drawing them, we have three importand zones or biases, as follows:
1. Upside bias
If the price is above the pivot which has the highest value - the bias is up (green colored zone).
2. Neutral bias
If the price is situated between the two pivot levels - the bias is neutral. (grey colored zone)
3. Downside bias
If the price is situated below the lowest pivot level - the bias is down. (orange colored zone)