ThirdBrainFx Market Commentary
Market Commentary – February 14, 2014
Earlier today, the Chinese National Bureau of Statistics released the year over year consumer price index, which came out at 2.5% against previously forecasted 2.4%. This economic indicator measures the change in the price of goods and services purchased by consumers, which indicates inflation level in the economy.
Later in the afternoon, the Statistics Canada will release the month over month manufacturing sales figure that measures changes in the total value of sales made by manufacturers in the economy. Since manufacturers are quickly affected by market conditions, changes in their sales can be an early signal of future activity level in the economy.
The University of Michigan will be releasing the Prelim Consumer Sentiment at 2:55 PM. This is an index that measures level of a composite based on consumer survey. The UoM asks 500 consumers to respond and rate the relative level of current and future economic conditions to figure out the consumer sentiment about the economy. Consumer spending has a big impact on the overall economic growth and investors pay keen attention to this index.
Gold Outlook
Gold price has jumped more than $20 an ounce during past 24 hours after downbeat US data and China’s growth optimism, the precious metal is however likely to resume correction from current levels, according to price action analysis.
At the time of writing this article, the yellow metal is being traded near $1305, the highest level since November. Immediate hurdle can be seen around $1307, channel resistance and 200 Daily Moving Average (DMA), ahead of $1318, 76.4% fib level. A sustained move above channel resistance might result in renewed bullish momentum, hence targeting $1352 or even beyond that level.
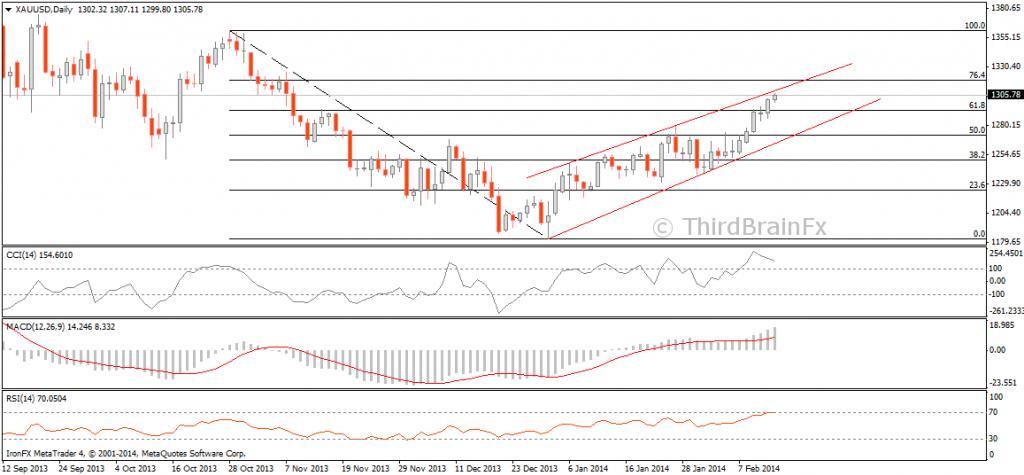
On downside, support can be noted at $1292, 61.8% fib level, ahead of $1271 which is 50% fib level, and then channel support (currently around $1263). A daily close below channel support could expose $1250 support area and then $1244, 50% fib level of the most recent move.
Retail sales in the US during January slid down by 0.4% and followed a revised 0.1% drop in a month before, a report released by the US commerce department revealed yesterday. Moreover, the number of people, claiming unemployment incentives, ticked up by $8,000 to 339,000 last week, a separate report by the US labor department showed. Analysts were expecting no change in retail sales and a decline by 1,000 in jobless claims. On Wednesday, Chinese authorities said that countries exports jumped by 10.6% in January, fueling growth optimism about the Asian nation. Economists had predicted only 2% increase in exports amid lunar vacations. China is the biggest consumer of bullion.
EURCHF Outlook
The EUCHF pair has been hit by the recent poor data for the US. The safe heavens are gaining bids for the last several days now. The pairs like USDCHF, USDJPY and EURCHF are trading lower. Also, the commodities like GOLD and SILVER are trading higher. I think the EURUCHF still remains supported on dips. However, the pair is again reaching a crucial junction, in my opinion.
Recently, the pair formed a channel, as shown in the 4 hour chart. The pair has breached this channel, and currently trading lower. Now, this can be considered as a critical break, as the pair is approaching crucial support region at around the 1.2200-1.2180 levels. The 1.2180 is a very important level. It would be interesting to see whether the pair manages to hold this or not. A breach of this level may call for further losses for the pair may be towards the 1.2120 level.
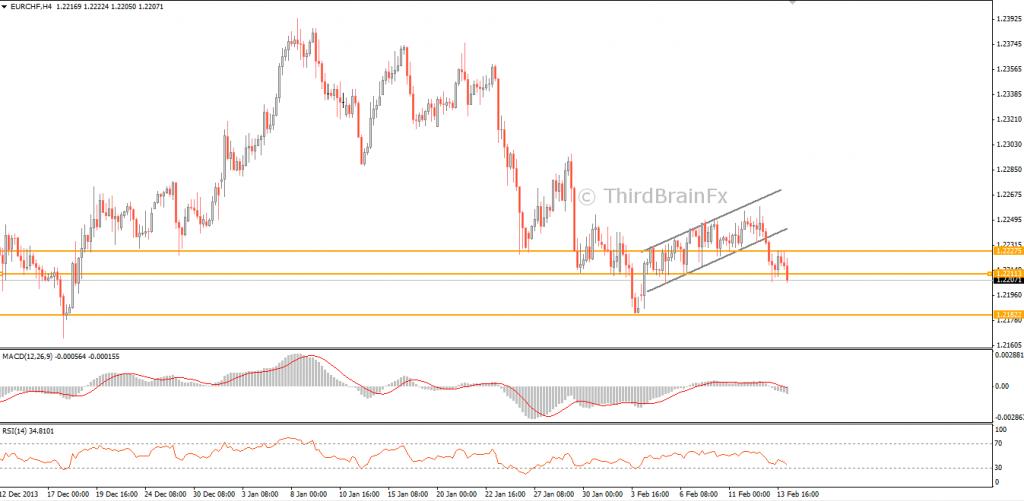
If the pair manages to bounce from the 1.2180 support level, then it would be a good sign. However, the pair will face a lot of resistance on the way up. Starting with the broken channel support area at around the 1.2220/30 levels. Only a break and close above these levels may put the pair back in the positive zone. The RSI is coming closer to the extreme levels, which suggest that there might be a relief for the pair in the short to medium term.
Market Commentary – February 17, 2014
There were plenty of economic data released during the weekend. The most important was the retail sales figure from Statistics New Zealand, which came out at 1.2% against previously forecasted 1.7%. The retail sales data is considered to be a primary gauge of consumer confidence as it measures the changes in the total value of inflation adjusted sales at the retail level.
The Australian Bureau of Statistics released the new motor vehicle sales data at GMT 12:30 AM. This economic indicator measures changes in the number of new cars and trucks domestically sold during the past month. As this data is a vitally related to consumer sales, and correlate to the sign of consumer confidence, investors keep a keen eye on the figure to predict future economic activity.
USDCHF Outlook
The USDCHF pair has been hit by the recent greenback and the risk-on sentiment. The pair failed above the 0.9080 level, and traded lower. The pair is again trading below the key 0.8980 swing level. The fall in the US dollar in the recent days has been consistent, and it has failed to gain any sort of ground against most of the major currencies.
Looking at the daily chart of USDCHF, the pair has breached 61.8% Fibonacci retracement level of the last major up-move from the 0.8798 to 0.9155 level. The pair has been trading just below the key fib support level, which means that the pair might eye the full 100% extension at around the 0.8800 level. If the pair is unable to rebound from the current levels, then we may witness some more losses for the pair in the short to medium term. There is also a down-move trend line, which is acting as a major hurdle for the pair. Until the pair is trading below this trend line, then bearish bias is favored for the pair.
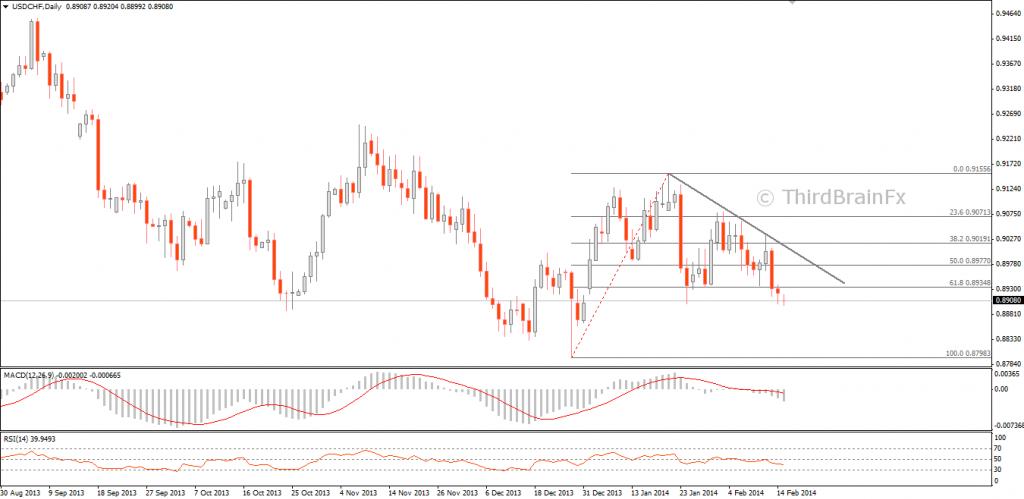
On the downside, a breach of 0.8800 level may call for a new lows in the pair. On the upside, 0.9000 level may act as a barrier for the pair. A break above this level might call for a test of the down-move trend line. The RSI is below the 50 level, and has struggled to trade above the same for quite some time now, which means the pair might remain under pressure for time.
EURUSD Outlook
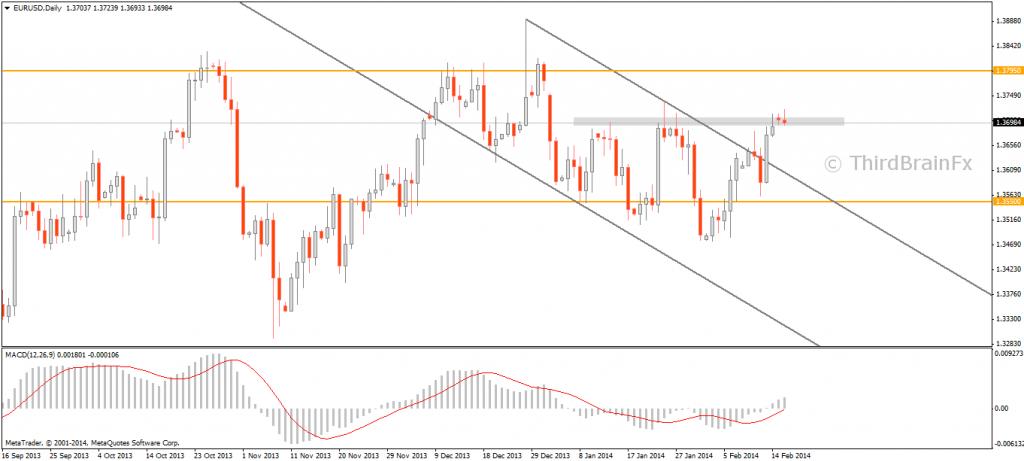
The EURUSD broke the downward sloping equidistant channel since late December, last year. It tested the upper trend line on February 11, but failed to close above, and ended up forming a bearish pin bar on the daily time frame. However, a day later, on February 13, the EURUSD managed to close above the trend line and reached the resistance zone around the 1.3700 level.
For last few days, this pair is consolidating around this resistance zone. Meanwhile, the MACD has crossed above the 0 line, and the MACD signal line is about to cross over 0, towards positive value. If the EURUSD observe further bullish buying pressure, it may move towards the next resistance zone, around the 1.3795 level.
If the EURUSD observe further bullish buying pressure, it may move towards the next resistance zone, around the 1.3795 level.
I think the EURUSD is nearing a critical resistance zone at around the 1.3770/80 level. This area represents a major overlap junction where the sellers are expected to return. There is also an up-move channel formed by the pair on the 4 hour chart, as shown below. The channel resistance level coincides with the mentioned area. So, we can say that there is a confluence of resistances around the same region.
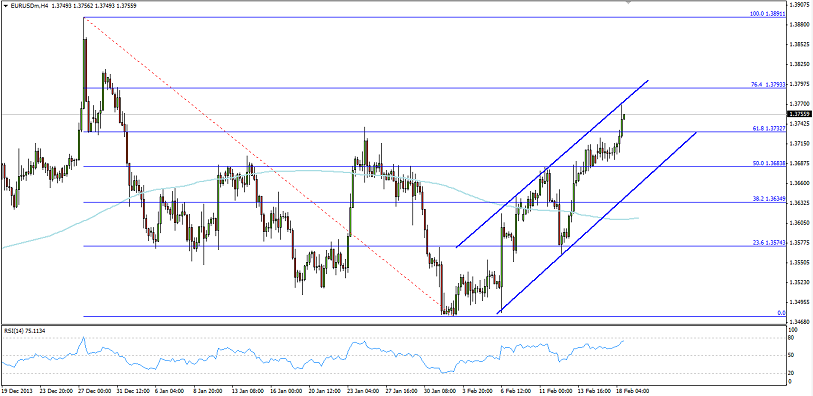
Only a break and close above the 76.4% fib level will increase the bullish pressure on the pair. And, then the buyers might try to push the pair towards the 1.3890 level again. So, I am watching this level very closely in the short term.
Market Commentary - February 18, 2014
This morning, the Reserve Bank of Australia released the monetary policy meeting minutes, and it had a positive effect on the Australian dollar. Most AUD basket of pairs spiked up within first hour. Particularly, the AUDUSD moved up around 60 pips during the first hour.
The ZEW released its German economic sentiment index, which measures the level of a diffusion index based on surveyed German institutional investors and analysts. Last month, the ZEW's German economic sentiment was at 61.7. However, this month, it came out way low at 55.7.
Later during the afternoon, the Bank of Japan also released its monthly monetary policy statement. Since it is considered to be among the primary tools that central banks use to communicate with investors, these policy meeting minutes usually have substantial impact on the market.
USDCAD Outlook
The USDCAD pair has managed to retrace some of the recent losses.The pair after creating a high at around the 1.1220 level has moved lower towards the major support at around the 1.0940/50 level. This level is very important in the short to medium term, as it represents a major volume close. So, the pair might struggle to break this support level.
There is a clear triangle formation on the 4 hour chart for the pair, as can be seen below.The pair is on a verge of a break, in my opinion. We may witness a swing move for the pair in the coming hours. The pair is consolidating in a very narrow range just ahead of the break. On the upside, I think a break above the 1.1000 level may push the pair higher again, as this is a critical resistance zone for the pair, as highlighted in the chart below. The RSI and MACD both are flat, in my opinion. A break above 50 in RSI would be a bullish call in the short term.
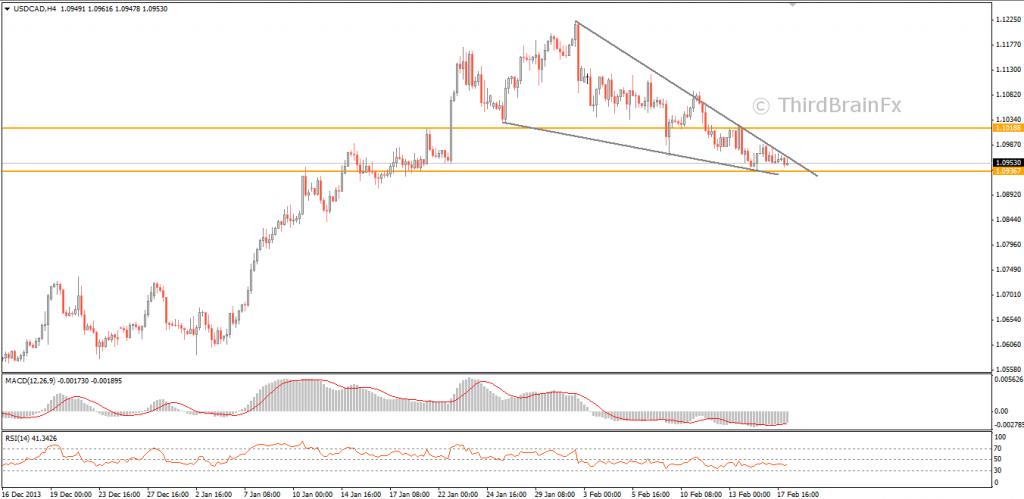
On the downside, as mentioned earlier, the 1.0930/40 is very crucial and a break below this level may push the pair towards the 1.0850 level. This can be an important break, and I think that if follow through below the triangle support and swing areais strong enough, then it might be seen as a bearish formation. In this case, the 1.1220 level might be termed as an important top in the medium term. So, I think coming hours are very critical for the pair, as it might decide the trend for the pair in the short term.
AUDUSD Outlook
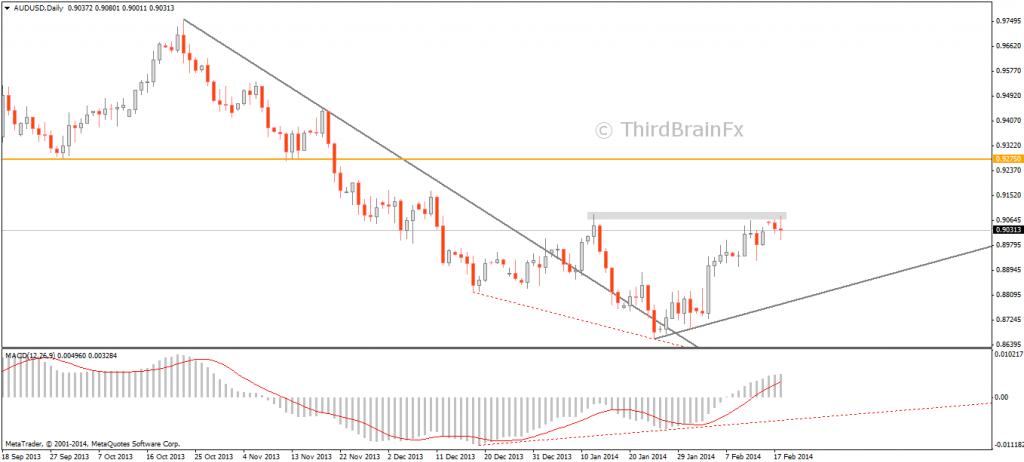
The AUDUSD is currently trading near the 0.9070 resistance level. This pair has tested this resistance level few weeks back. If the AUDUSD price bounce from here, it will end up forming a double top reversal pattern.
The AUDUSD has formed a MACD divergence on the daily time frame. After breaking the long standing downward sloping trend line, it quickly bounced and formed a new upward sloping trend line after the divergence was formed. If the AUDUSD can penetrate and close a above the 0.0970 resistance level in the next few days, this pair will find next major resistance at the 0.9275 area.
Market Commentary - February 19, 2014
Earlier today, the UK's claimant count change figure came out at -27,600 against previously forecasted -18,300. The Office for National Statistics in the UK release this figure as a change in the number of people claiming unemployment-related benefits during the previous month. It also released the unemployment rate in the UK, which unexpectedly rose to 7.2% against previously forecasted 7.1%.
The US Census Bureau released the new building permits figure, which came out at 0.94m. Industry analysts were predicting this figure to be around 0.98m. Hence, it appears that the US housing market will likely to slow down in near future, based on this monthly data as this economic indicator is an excellent gauge of future construction activity because obtaining a permit is among the first steps in constructing a new building.
AUDNZD Outlook
Few days back we shared an analysis on the AUDNZD pair in which we highlighted the importance of the 1.0900/10 level.The same level has acted as a resistance several times during the last several days. The 38.2% retracement level of the last major down-move from the 1.1580 level sits around the same region. There are a couple of spikes around the same area. However, the pair has failed to overtake the same.
There is also a down-move trend line, as plotted in the daily chart shown below. This trend line also coincides with the 38.2% fib level. So, in short to medium term the pair may find it hard to overtake this region. However, a break above the mentioned levels may be a bullish call, as the pair might rise towards the 50.0% Fibonacci retracement at around 1.1035 level. I think there is also a possibility of an inverse head and shoulders formation with a clear hurdle at around the 1.0880 level. The MACD is under a small divergence, which is an early warning sign.
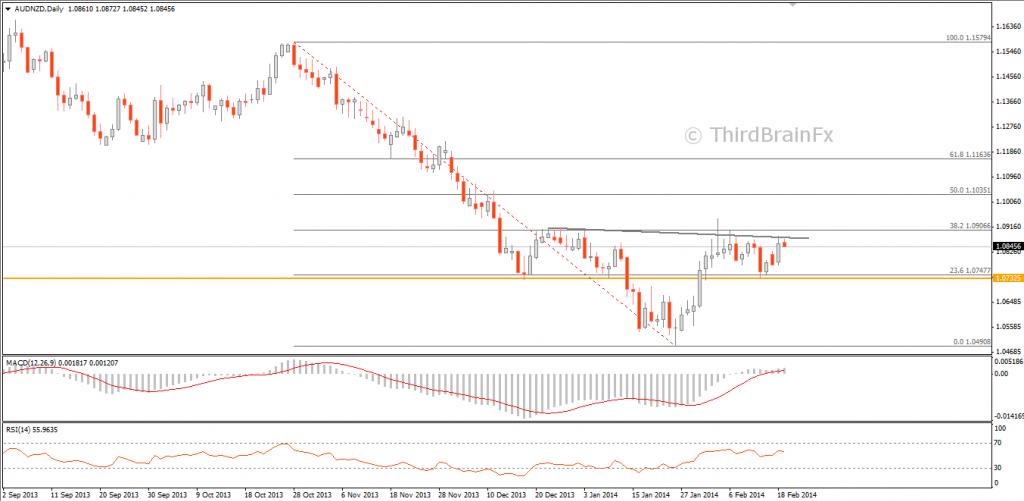
On the downside, as mentioned earlier, the 1.0740 level is very critical.This particular level has supported the pair several times. A break below this level, may interrupt the possibility of an inverse head and shoulders formation. After a breach of this level the pair might eye the precious low at around the 1.0500 level. So, I think we need to be very careful trading this pair in the short term, and should wait for a break before jumping into a trade.
AUDJPY Outlook
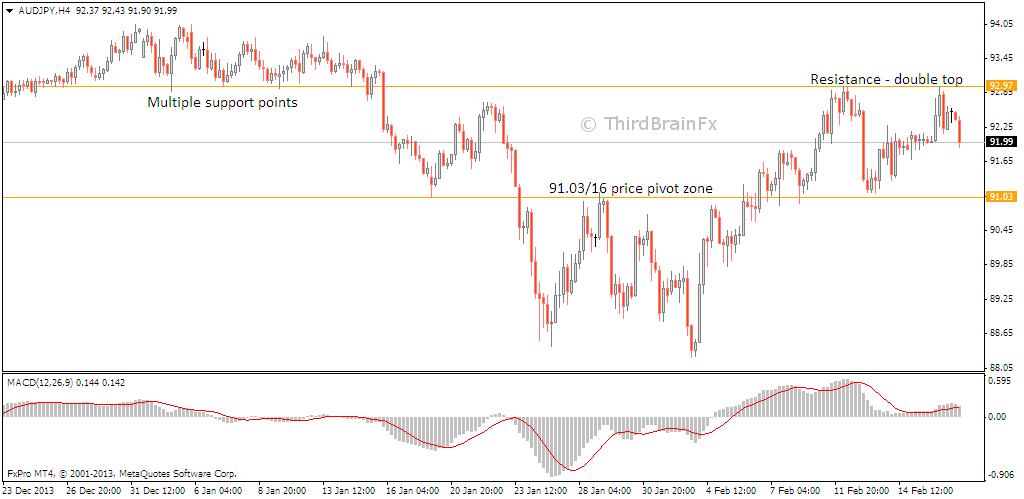
AUD/JPY seems to have hit a roadblock ahead of 93.00. This area offered strong support during the first weeks of January. This time around it is acting as similarly strong resistance. A perfect double top formation with identical highs at 92.97, coupled with a weaker MACD on the second top, takes some steam out of AUD/JPY’s bullish moves and increases the chances of a retracement.
Towards the downside we can observe another strong pivot zone around 91.03 – 91.16. This price pivot area has acted as support and resistance multiple times in the last few weeks. All trades aiming towards the downside should first account for this level, since price may bounce up once again. If AUD/JPY successfully crosses below 91.00, it opens up the way towards 88.00
Since price is currently squeezed between two very strong pivot zones, AUD/JPY might also take on a range behavior – erratic and choppy - until such a time when a break will occur above 93.00 or below 91.00. If that will be the case, it will be best to wait for the breakouts instead of trading within these boundaries.
I think the EURUSD is nearing a critical resistance zone at around the 1.3770/80 level. This area represents a major overlap junction where the sellers are expected to return. There is also an up-move channel formed by the pair on the 4 hour chart, as shown below. The channel resistance level coincides with the mentioned area. So, we can say that there is a confluence of resistances around the same region.
Thanks for sharing your views. Hope to have a meaningful discussion with everyone here.
Market Commentary - February 20, 2014
It was an eventful day as there were more than a handful of important data releases. One of the major one was the US Core CPI figure which measures change in the price of goods and services purchased by consumers, excluding food and energy. Since the volatility of food and energy price is pretty high, investors prefer to pay more attention to the core CPI data.
The US Department of Labor will publish this week's unemployment claims figure during the afternoon. Last week, the figure came out at 339K, and this week the forecast is 335K. Although it's generally viewed as a lagging indicator, the number of unemployed people is an important signal of overall economic health. Also, the Federal Reserve often look to keep the employment rate at full with its monetary policy. Hence, this is considered to be an important data.
EURNZD Outlook
In an analysis for the EURNZD pair shared few days back, we highlighted the importance of an up-move trend line. The same trend line again acted as a barrier for the pair, and the pair bounced sharply from the same.The recent pullback in the risk has caused a slide in the New Zealand dollar. However, the Euro has managed to hold on the gains. This has resulted in a rally for the EURNZD pair.
An important thing to note here is that the pair is coming off from the 61.8% Fibonacci retracement level of the last major up-move from the 1.5912 to 1.6995 levels. So, this can be seen as an important rally in the pair. The RSI has breached the 50 level, and looks set for a test of 70 or even 80 level. There is a divergence on the MACD as well, which suggest that the rally has legs and can take the pair higher from the current levels. On the upside, the 1.6740/50 is still a major hurdle for the pair. If the buyers manage to break this level, then we can expect more strength in the pair in the coming days.
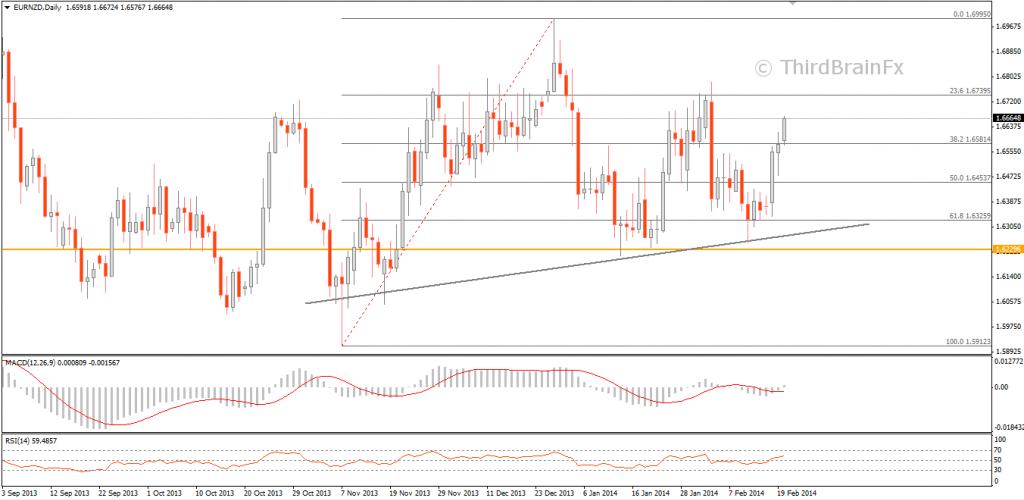
On the downside, as mentioned earlier, the 1.6480/60 region may act as initial support.A break below this area may again call for a test of the key swing level of 1.6325. This level is now coinciding with the up-move trend line. If the sellers take control, then we can also witness a break of this area, and a test of the previous low.
EURAUD Outlook
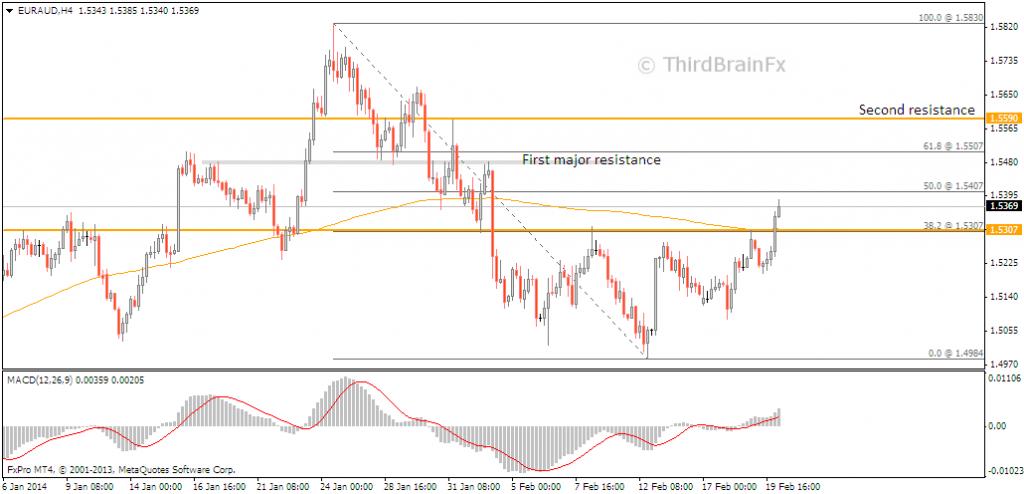
Since the beginning of the year, EURAUD has failed again and again to break and close below the support level at 1.5020. More recently, the pair has swung back and forth between this support and 1.5307. The latter is a recent pivot zone, formed on 38.2% retracement of the last major bearish move and, to top it all off, the 200 Simple Moving Average on 4H caught up with this level on Wednesday. A confluence of resistance signals of this magnitude, when broken, more often then not leads to fast rallies.
In recent hours EURAUD finally broke above the major resistance cluster at 1.5307. This bullish swing appears as if it going to target the next resistance area between 1.5480-1.5507, where 61.8% retracement on the last major bearish move and a smaller pivot zone are likely to take some steam out of the bullish rally. Further up, in the 1.5590 area, there is yet another resistance formed by previous highs. With MACD on Daily timeframe still negative, reversals – or at least partial corrections – are to be expected around the previously mentioned resistance levels.
Towards the downside, EURAUD can always come back to re-test the 1.5307 pivot zone before attacking the main resistance areas. The pair should not be considered bearish unless it closes and stabilises below 1.5307.
Thanks for sharing your views. Hope to have a meaningful discussion with everyone here.
Thanks for replying mate. I really appreciate it. I really do hope threads like these turn out to be useful for traders and viewers. Cheers!
Market Commentary – February 21, 2014
Today, there are several important data releases are scheduled. Early in the morning, the UK's monthly retail sales figure will be released by the Office for National Statistics. This particular indicator measures the changes in the total value of inflation adjusted sales at the retail level in the United Kingdom. As it is considered to be a primary gauge of consumer spending, which accounts for the majority of overall economic activity, investors pay keen attention to the changes in the retail sales figure on a month over month basis. The UK's retails figure will be released at 9:30 AM, and the forecast is set at -0.9% against last month's 2.6%, indicating a slowdown in the retail sector.
During the afternoon, at GMT 1:30 PM, the Statistics Canada will release the core CPI (m/m) and the Core Retail Sales (m/m) figure. While the core CPI is an important measure of the nation's inflation situation, the retail sales measures the sales at the retail level. The core retail sales is forecasted to come out at 0.2% against last month's 0.4%, and the core CPI is forecasted to come out at 0.1% against last month's -0.4%.
After an hour and half, at GMT 3:00 PM, the US National Association of Realtors will be releasing the annualized number of residential buildings that were sold during the previous month, better known as the existing home sales figure. However, this data exclude any new construction in the United States. This month, the existing home sales is expected to come down to 4.73 million from last month's 4.87 million.
USDJPY Outlook
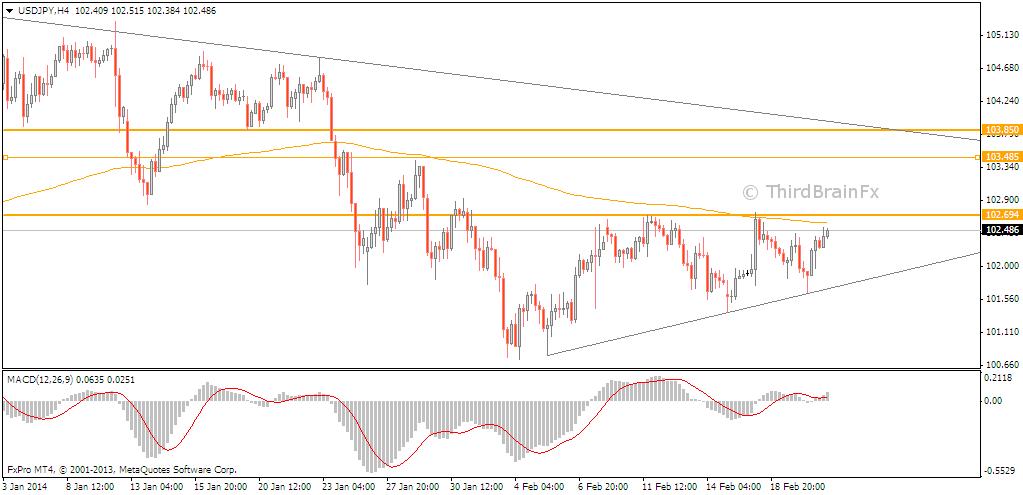
Since last week’s analysis, USD/JPY has been struggling to find a clear direction. The major bearish trend has not been invalidated at all, with all attemps at stopping a higher high stopping dead in the tracks ahead of 102.70. This is where the last lower high stands in the current downtrend. While price stays below this level the bearish trend should not be ruled out.
However, on a more recent note, following the first two rejections from 102.64-102.70 resistance area and the subsequent drop to 101.38, USD/JPY has been gradually forming an ascending triangle chart pattern. On the 4H timeframe MACD shows indecision more then anything else, while the 200 Exponential Moving Average has caught up with the resistance and presently adds to its strength.
For upside potential above 102.70, the resistance lines can be found at 103.37, followed by 103.85. The latter will soon match the bearish trendline based on the swing highs in January.
Towards the downside, If the triangle support is broken the bearish trend will resume. This will open the way towards 100.75 and if that fails to hold, towards the big round number 100.00.
EURGBP Outlook
The strength in the pound has driven the Euro down for some time.However, it looks like that the pound is stabilizing at the current levels, and the EURGBP buyers are trying to get an advantage of the same. The pair after declining towards the 0.8156support level has bounced sharply. However, there are still no signs of strength in the pair.
The pair tested the 50.0% Fibonacci retracement level of the last down move from the 0.8349 to 0.8156 level. The pair failed to overtake the same, and sellers reappeared around the 0.8250 level. As of writing, the EURGBP is flirting with the 38.2% fib level. There is also a trend line, as can be seen in the 4 hour chart below, which is coinciding with the critical resistance zone at around the 0.8260/80 levels. I think that the buyers might struggle to take the pair above this resistance zone. A breach of this area may call for a test of full 100% extension in the near future.
On the downside, initial support lies at around the key physiological support at around the 0.8200 level. The 23.6% Fib level may now act as a support around the same level. A breach of this level might take the pair towards the previous low. The MACD is under strong divergence, which suggest a pullback may be on the cards. The RSI is above 50 level, which is a positive sign in the short term.
Since last week’s analysis, USD/JPY has been struggling to find a clear direction. The major bearish trend has not been invalidated at all, with all attemps at stopping a higher high stopping dead in the tracks ahead of 102.70.
I agree I also see in my charts the importance of the 102.80 resistance zone. There is a trend line around the same level, which has acted as a resistance more than a couple of times for the pair. This trend line is coinciding with the precious swing level around the same level. So, one can say that there are plenty of reasons for the sellers to be active around the 102.80 level.
A break and close above this zone may be a bullish call for the pair. If this happens, then I might even consider buying the pair. I am not sure, but I will have a close look at the price action, and act accordingly.
- Free trading apps
- Over 8,000 signals for copying
- Economic news for exploring financial markets
You agree to website policy and terms of use
Hi All,We would like to offer a daily technical analysis based market commentary to the Forex TSD community on this thread. You are most welcome to share your views and participate in a constructive manner.Thanks.