ThirdBrainFx Market Commentary - page 6
You are missing trading opportunities:
- Free trading apps
- Over 8,000 signals for copying
- Economic news for exploring financial markets
Registration
Log in
You agree to website policy and terms of use
If you do not have an account, please register
Hi, this is our new video. Hope you like it and we'll be glad to have your feedback. Thanks!
New Zealand Trade Balance May Push the NZD/CAD Price Out of its Current Narrow Range
Although Monday would be a bank holiday in some of the major economies around the world, including the United States, there are some major data releases scheduled in the coming few days to move the global Forex markets.
On Monday, at GMT 10:45 p.m., the Statistics New Zealand will release the national trade balance figure, which measures the difference in value between net import and export of products and services over the previous month.
Since export demand is directly correlated to the currency demand of the New Zealand Dollar, Forex market participants consider the trade balance to be a very important fundamental indicator.
In the end of April, the trade balance figure of New Zealand came out at 631 million and the forecast for May is currently set at 105 million.
Later in the week, on Wednesday, at GMT 2:00 p.m., the Bank of Canada (BOC) will release the overnight rate, which measures the interest rate that major banks and financial institutions in Canada uses to borrow and lend funds between themselves.
Overnight interest rates are the main factor in the valuation of any fiat currency and Forex traders often analyze all other fundamental indicators in order to predict future monetary policy and rate decisions. Hence, any substantial change in the BOC overnight rate can create unprecedented volatility in the global Forex market.
The Bank of Canada kept its overnight interest rate at 0.75% since January 2015 and the forecast for May is that the BOC will keep it at 0.75% for the time being.
NZD/CAD Outlook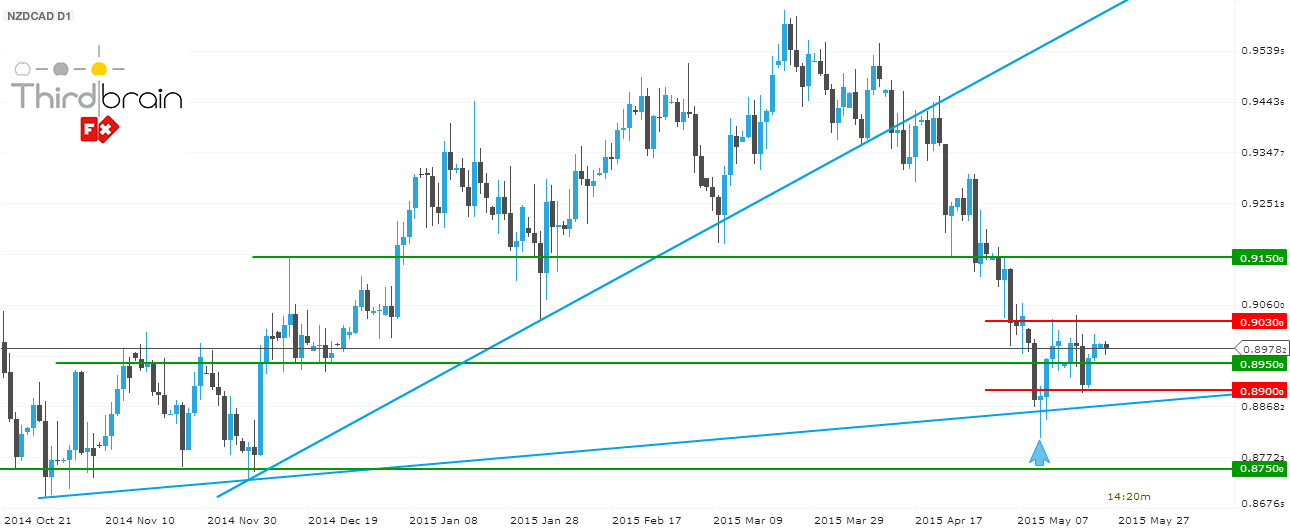
The NZD/CAD has remained in a steady uptrend since November 2014 and formed two well-respected upward sloping trend line in the process.
However, on April 13, 2015, the NZD/CAD price broke below the intermediate uptrend line and subsequent bearish momentum pushed the price to as low as 0.8810 by May 12, 2015.
After the NZD/CAD found support around the long-term uptrend line, it formed a bullish pin bar. The pin bar broke upwards on May 13 and pushed the price above the resistance zone around 0.8950. Since then, the NZD/CAD has traded within a narrow range between 0.8900 and 0.9030.
As the trade balance of New Zealand is forecasted to come down to 105 million, it may add further bearish momentum to the NZD/CAD price. However, the NZD/CAD will find two strong support just below the current range’s low, the long-term trend line and an additional psychological support level around 0.8750.
If the NZD/CAD price penetrates below the 0.8840 level, there is a high chance that the price may fall towards 0.8750. On the other hand, if the NZD/CAD price closes above the 0.9030 level, it may attract additional bullish momentum which would push the price towards the resistance around the 0.9150 level.
Under the circumstances, there are two potential trades with the NZD/CAD, base on which side of the range the price will break out.
Long Trade Setup:
Position Size Suggestion based on 2% of Equity using the Percentage Risk Model (PRM)
For Account Size: US$ 1,000, position size should be 0.25 lots (mini)
For Account Size: US$ 5,000, position size should be 1.3 lots (mini)
For Account Size: US$ 10,000, position size should be 2.5 lots (mini)
Pending Buy Stop Entry: 0.9040
Stop Loss: 0.8940
Take Profit: 0.9150
Short Trade Setup:
Position Size Suggestion based on 2% of Equity using the Percentage Risk Model (PRM)
For Account Size: US$ 1,000, position size should be 0.3 lots (mini)
For Account Size: US$ 5,000, position size should be 1.5 lots (mini)
For Account Size: US$ 10,000, position size should be 3 lots (mini)
Pending Sell Stop Entry: 0.8830
Stop Loss: 0.8910
Take Profit: 0.8750
AUD/NZD Reached Our Bullish Target, May Move Further Up
On Tuesday, at GMT 4:30 a.m., the Reserve Bank of Australia (RBA) will release the official cash rate, which is the interest rate that the financial institutions and banks in Australia charge for loans made between themselves.
Forex traders consider the official cash rate set by the RBA to be the most important factor in the valuation of the Australian Dollar against other major currencies. Most currency strategists analyze all other fundamental economic data just to predict future monetary policy and cash rate of the RBA. Hence, any unexpected change in the RBA’s cash rate can create substantial volatility in the global Forex market on Tuesday.
In May, the RBA reduced its cash rate from 2.25% to 2.00% and the forecast for June is that the RBA will keep its 2.00% cash rate unchanged.
On Tuesday, the New Zealand based Global Dairy Trade (GDT) will also release its price index, which measures the changes in the average price of dairy products sold during auctions in New Zealand.
Since the dairy industry has a large contribution to the New Zealand’s economy, any large change in the GDT price index can act as a leading indicator of the country’s trade balance with other countries. This is primarily because an increase in the price index would signal higher export income for local dairy producers.
The GDT price index is released every two weeks, and on May 19, the index reading decreased by 2.2%. Since the GDT price index has fallen since March, there is a good chance that this week’s index reading would also suggest a further decrease in the price of dairy products.
AUD/NZD Outlook
As the AUD/NZD price broke the downtrend line on April 24, we forecasted on May 4, that the pair would move as high as 1.0800. Our prediction came true on May 12.
Since reaching the 1.0840 level, the AUD/NZD found strong resistance and failed to close above this level in the last several weeks. During this time, the AUD/NZD tested this resistance level twice, and both times the attempt resulted in bearish price action that pushed the price lower.
However, on May 28, the AUD/NZD formed a bullish pin bar, which broke on Friday and pushed the price towards the psychological resistance around 1.0800 level once again.
It is worth noting that during the last downward swing, the AUD/NZD has already broken below the sharp uptrend line, which was formed after the pair broke above the long-term downtrend line on April 24. Hence, there is still a possibility of further bearish movement.
In contrast, the fundamental outlook has not changed, the GDT price index has continued to fall over the past month and the reduction in cash rate last month by the Reserve Bank of Australia should boost economic activity and help sustain the current uptrend of the AUD/NZD.
Given the mixed circumstances, the AUD/NZD price may continue to trade within a range between 1.0500 and 1.0800. However, if it penetrates above the 1.0840 level and a bullish price pattern bar appears around this level, we would once again recommend Forex traders take a long position with the AUD/NZD.
On the other hand, if the AUD/NZD price goes towards the 1.0500 level, and show any bullish price action, it may offer another opportunity to buy the pair with a better risk to reward ratio.
Hence, there are two possible buy orders for the AUD/NZD.
Long Trade Setup - 1:
Position Size Suggestion based on 2% of Equity using the Percentage Risk Model (PRM)
For Account Size: US$ 1,000, position size should be 0.3 lots (mini)
For Account Size: US$ 5,000, position size should be 1.5 lots (mini)
For Account Size: US$ 10,000, position size should be 3.0 lots (mini)
Pending Buy Stop Entry: 1.0870
Stop Loss: 1.0780
Take Profit: 1.1045
Long Trade Setup - 2:
Position Size Suggestion based on 2% of Equity using the Percentage Risk Model (PRM)
For Account Size: US$ 1,000, position size should be 0.15 lots (mini)
For Account Size: US$ 5,000, position size should be 0.75 lots (mini)
For Account Size: US$ 10,000, position size should be 1.5 lots (mini)
Pending Buy Limit Entry: 1.0520
Stop Loss: 1.0325
Take Profit: 1.0800
GBP/NZD is Trading Near Uptrend Line after Reaching Our Profit Target
On Wednesday, at GMT 8:30 a.m., the UK’s Office for National Statistics will release the month-over-month manufacturing production data, which measures the changes in the total value of all output produced by the manufacturing sector in the country.
Since the manufacturing sector contributes up to 80% of the total industrial production capacity in the United Kingdom, Forex traders consider the manufacturing production data to be an important fundamental indicator of the overall economy.
In May, the UK’s manufacturing production increased by 0.4% and the forecast for June is currently set at a reduced growth rate of 0.1%.
Later in the night, at GMT 9:00 p.m., the Reserve Bank of New Zealand (RBNZ) will release the official cash rate for next time period, which is the interest rate that banks and other large financial institutions in New Zealand use to lend overnight funds among themselves.
Forex traders consider the official cash rate of a country to be the most vital factor in its currency valuation against other fiat currencies. In fact, most of the currency strategists consider all other fundamental economic data in order to predict future monetary policy and overnight cash rates. Hence, a substantial change in the official cash rate in New Zealand can create unprecedented volatility in the global foreign exchange market.
For the last several months, the RBNZ has kept its official cash rate at 3.50% and the forecast for the next period is that they would leave it at 3.50% for the time being.
GBP/NZD Outlook
As we forecasted on May 19, the GBP/NZD reached our profit target around 2.1525 by May 29. Currently, the GBP/NZD price is trading above this resistance level and the uptrend line, around 2.1550.
Given that this week, the official cash rate from RBNZ is forecasted to remain at 3.50% and the UK’s manufacturing is set to decrease to a 0.1% growth, overall the fundamentals for this pair is neutral.
However, depending on the fundamental direction, if the actual figures come out differently, it can push the bar much higher or start a retracement. Since the GBP/NZD had been in an uptrend for the last several weeks, it would be recommended that Forex traders only consider placing long orders until the price does not close below the uptrend line.
Long Trade Setup:
Position Size Suggestion based on 2% of Equity using the Percentage Risk Model (PRM)
For Account Size: US$ 1,000, position size should be 0.17 lots (mini)
For Account Size: US$ 5,000, position size should be 0.85 lots (mini)
For Account Size: US$ 10,000, position size should be 1.7 lots (mini)
Pending Buy Stop Entry: 2.1720
Stop Loss: 2.1380
Take Profit: 2.2325
USD/CAD Appears Bearish Amid Lower than Expected Empire State Manufacturing Index
At 12:30 p.m., the Statistics Canada released the month-over-month manufacturing sales data, which measures the changes in the total value of sales made by national manufacturers over the past month in Canada.
As manufacturers are the first to get affected by changing market conditions, any sudden shift in the manufacturing sales can indicate future corporate economic activity, including expenditure, job creation, and capital investments. Hence, Forex traders consider the manufacturing sales data to be an important leading indicator of the Canadian economy.
In May, the Canadian manufacturing sales (m/m) figure increased by 2.7% and the forecast for June was set at a decrease of 1.3%. However, the actual data suggested that manufacturing sales have gone down as much as 2.1% over the past month.
At 12:30 p.m., the Federal Reserve Bank of New York also released its empire state manufacturing index reading, which measures the level of a diffusion index by surveying 200 manufacturers in the state of New York.
The survey asks respondents to rate the relative level of overall business conditions in New York. Since New York’s economy has a large contribution to the overall US economy, Forex market participants consider the empire state manufacturing index for New York to be an important signal of the overall US economy.
Last month, the empire state manufacturing index reading came out at 3.1, and the forecast for June was set at 5.8. The actual index reading, however, came out way below the forecast, at negative 2.0, indicating deteriorating conditions.
USD/CAD Outlook
Since the USD/CAD broke below the long-term upward sloping trend line on April 5, the momentum had remained largely bearish. After the USD/CAD price reached the 161.8% Fibonacci extension level of the range between 1.2350 and 1.2836 in the end of April, it retraced back towards the 61.8% retracement level of this range in June.
However, the USD/CAD price formed a double top pattern on June 5, and resumed the downtrend over the last week and closed below the important resistance level around 1.2350. Today, the USD/CAD price once again was rejected around 1.2350, and currently it is trading near the 38.2% Fibonacci level of the last upward swing towards 1.2563.
As the empire state manufacturing index reading came out way lower than the forecast, the fundamental outlook for the USD/CAD is would be bearish over the next few days. Under the circumstances, if the USD/CAD price breaks below last week’s low, at 1.2200, it is likely to travel further south this week.
TRADING ADVICE
Short Trade Setup:
Money Management Advice
For Account Size: US$ 1,000, position size should be 0.28 lots (mini)
For Account Size: US$ 5,000, position size should be 1.4 lots (mini)
For Account Size: US$ 10,000, position size should be 2.8 lots (mini)
Orders
Pending Sell Stop Entry: 1.2190
Stop Loss: 1.2365
Take Profit: 1.1960
EUR/USD Uptrend is Capped by Significant Resistance at 1.1435
On Monday, at GMT 2:00 p.m., the US National Association of Realtors released the existing home sales figure, which measures the changes in an annualized number of residential buildings, which were sold over the previous month. However, the existing home sales figure does not include newly constructed homes in order to provide an accurate picture of secondary market sales of homes.
Forex traders consider the existing home sales figure to be an important leading indicator of the overall economic health of the United States. This is primarily because sale of an existing home tend to create a wide ranging positive domino effect in the economy. Such as, often new mortgage is taken by the new owners of the house and home renovation projects create jobs.
In May, the existing home sales figure came out at 5.04 million and the forecast for June was set at an improved figure, at 5.27 million. However, the actual figure came out much better than what the market analysts were expecting, at 5.35 million.
Later in the week, on Tuesday, at GMT 7:30 a.m., the Markit will release the German flash manufacturing PMI, which measures the level of a diffusion index by surveying 500 purchasing managers from the Germany’s manufacturing industry.
The large number of survey respondents of the survey makes it one of the most important fundamental indicators of the German manufacturing sector. Since purchasing managers are asked to rate the relative level of business conditions such as employment, production, new orders, price levels, and inventory situation, Forex traders can often measure the overall economic health of Germany by closely studying the flash manufacturing PMI reading.
Last month, the German flash manufacturing PMI reading came out at 51.1 and the forecast for June is currently set a slightly improved reading, at 51.5.
EUR/USD Outlook
Although the EUR/USD has been on a steady downtrend since the end of June 2014, it has been showing signs of a change in the prevailing trend since March 2015. In fact, after reaching as low as 1.0462 on March 15, the EUR/USD price has moved up considerably and formed two uptrend lines in the process.
The EUR/USD upward movement has been limited by the strong resistance zone around 1.1435. Last week, the EUR/USD price was once again rejected around this resistance zone.
As the existing home sales in the United States increased significantly over the past month, it indicates a strong economic climate in the country. In contrast, the forecast for the German flash manufacturing PMI is set at an insignificant increase. Hence, the fundamental outlook for the EUR/USD this week would be bearish.
However, if the EUR/USD price penetrates above 1.1460 and closes above this level on the daily timeframe, it would certainly signal additional bullishness. In that case, it may move towards the 161.8% Fibonacci extension level over the next few weeks.
TRADING ADVICE
Long Trade Setup:
Money Management Advice
Position Size Suggestion based on 2% of Equity using the Percentage Risk Model (PRM)
For Account Size: US$ 1,000, position size should be 0.15 lots (mini)
For Account Size: US$ 5,000, position size should be 0.75 lots (mini)
For Account Size: US$ 10,000, position size should be 1.5 lots (mini)
Orders
Pending Buy Stop Entry: 1.1470
Stop Loss: 1.1195
Take Profit: 1.1845
GBP/AUD Appears Bullish Amid Expectation of Improving Current Balance
On Tuesday, at GMT 8:30 a.m., the UK’s Office for National Statistics will release the current account figure, which measures the difference of value between net import and export of goods, services, income flows, and unilateral transfers over the past quarter.
Although the trade balance figure represents the difference between import and export, the current account figure provides a clearer picture regarding the currency demands as it includes other data such as unilateral transfers. Hence, Forex traders consider the current account figure to be a more important indicator of the UK’s economy.
In the first quarter of 2015, the UK’s current account balance came out at -25.3 billion and the forecast for the second quarter of 2015 is currently set at a slightly improved figure, at -23.7 billion.
Later on Wednesday, at GMT 1:30 a.m., the Australian Bureau of Statistics will release the month-over-month building approvals figure, which measures the changes in the number of new building approvals issued over the past month.
As it requires a building approval in order to start construction of a new building, the building approvals figure acts as a leading indicator of future construction activity in the Australian economy. Hence, Forex traders pay close attention to the building approval figure.
On June 1, the Australian building approval figure decreased by 4.4%. However, over the last one month it seems to have rebounded and the forecast for the building approvals in June is currently set at an increase of 1.1%.
GBP/AUD Outlook
After breaking above the psychologically important resistance zone and a Big Round Number (BRN) around 2.000, the GBP/AUD continued its bullish trend over the last two weeks. Last Friday, the pair penetrated above the last up fractal and retraced to 61.8% Fibonacci level of the last downward swing towards the intermediate uptrend line.
Given that the UK’s current account balance is expected to improve over the second quarter of 2015, it would likely create additional bullish momentum in the foreign exchange market.
Hence, it would be recommended that Forex traders consider taking a long position at the market price as long as the GBP/AUD price remains below 2.0567.
TRADING ADVICE
Long Trade Setup:
Money Management Advice
For Account Size: US$ 1,000, position size should be 0.13 lots (mini)
For Account Size: US$ 5,000, position size should be 0.65 lots (mini)
For Account Size: US$ 10,000, position size should be 1.3 lots (mini)
Orders
Stop Loss: 2.0369
Take Profit: 2.0765NZD/USD Downtrend May Continue amid Forecast of a Declining Trade Balance
Today, at GMT 10:00 p.m., the New Zealand Institute of Economic Research (NZIER) will release its business confidence index, which measures the level of a diffusion index by surveying 2,500 businesses, including manufacturers, builders, wholesalers, retailers, and various other service providers in the country.
Forex traders consider the NZIER business confidence index to be an important leading indicator of the New Zealand’s economy as businesses are the first to react to the changing economic conditions and a change in their collective perspective regarding the economy can signal future economic activity in the country.
During the last reporting period, in April, the NZIER business confidence index reading came out at 23 and any figure above 23 would indicate a bullish New Zealand dollar over the next few months.
Later on Tuesday, at GMT 12:30 p.m., the US Bureau of Economic Analysis will release the national trade balance figure, which measures the changes in the difference in value between net import and export of goods and services over the past month.
Since the export demand from New Zealand is directly correlated with the demand for the New Zealand Dollar, an improving trend balance signals bullish NZD in the global foreign exchange market. Therefore, Forex market participants consider the trade balance to be a leading fundamental indicator of the New Zealand Dollar’s strengths.
Last month, in June, the New Zealand trade balance figure came out at -40.9 billion, and the forecast for July is currently set at a slightly lower figure, at -42.8 billion.
NZD/USD Outlook
Since forming a Double Bar High Lower Close (DBHLC) pattern on April 29, the NZD/USD has been on a steady downtrend. As the uptrend line was broken, the pair climbed do from around 0.7500 to as low as around 0.6600 over the last two months.
As the New Zealand’s trade balance figure is expected to go further down this month, the fundamental outlook for the NZD/USD price would be bearish over the next few days. Hence, it would be recommended that Forex traders consider placing a short order once the NZD/USD price penetrates below last week’s low, at 0.6645.
TRADING ADVICE
Short Trade Setup:
Money Management Advice
For Account Size: US$ 1,000, position size should be 0.2 lots (mini)
For Account Size: US$ 5,000, position size should be 1.0 lots (mini)
For Account Size: US$ 10,000, position size should be 2.0 lots (mini)
Orders
Stop Loss: 0.67400
Take Profit: 0.6505
AUD/CHF Forms DBHLC Patterns and Appears Bearish
Tomorrow, at GMT 1:30 a.m., the National Australia Bank Limited (NAB) will release their business confidence index, better known as the NAB Index. It measures the level of a diffusion index, which is created by surveying 350 Australian businesses that asks the respondents to rate the relative level of the current Australian business conditions.
Forex traders and market analysts consider the NAB business confidence index to be an important leading indicator of the Australian economy. This is primarily because the businesses tend to react to changing market conditions very quickly. Since the NAB surveys businesses, their index reading reflects any optimism or pessimism of a range of businesses in Australia.
For the last two months, in May and June, the NAB business confidence index reading came out at 3 and 7, respectively. Although there is no market forecast for July at the momentum, if the trend continues, it would likely to come around or above 7.
Later in the morning, at GMT 7:15, the Swiss Federal Statistical Office will release the monthly producer price index (PPI), which measures the changes in the price of products and raw material to produce finished goods by Swiss manufacturers over the previous month.
The PPI acts as a measure of future consumer inflation in the country because manufacturers pay more to buy raw material, that extra cost is passed to the consumers in the end. Hence, Forex traders consider the Swiss PPI to be a leading indicator of consumer inflation in the country.
Last month, the Swiss PPI declined by 0.8% and the forecast for July is currently set at a modest increase of 0.2%.
AUD/CHF Outlook
Since the massive price decline amid the removal of EUR/CHF peg on January 15, the AUD/CHF has remained mostly bearish over the last two quarters and formed a downtrend line in the process.
Since the end of May, the bearish momentum has declined and the AUD/CHF price mostly remained within a tight range between the 0.7100 and 0.7290 levels.
However, on July 3, the price finally closed below the 0.7100 level and the retracement towards this level was rejected by forming a bearish pin bar on July 6. Also, the AUD/CHF price has failed to penetrate above the 0.7100 level since July 3. This is evidence of a strong resistance forming around the 0.7100 level in the last two weeks.
Last week, on Friday, the AUD/CHF price had a bearish bar, where the high of the bar was near to the high of the Thursday bar. Which effectively makes it a Double Bar High Lower Close (DBHLC) pattern.
Since last week’s low aligns perfectly with the 161.8% Fibonacci extension level of the last range, a penetration below this level would trigger additional bearish momentum in the market. Furthermore, the forecast for a rebounding Swiss PPI is indicating a more bearish fundamental outlook for the AUD/CHF as well.
In that scenario, it would be recommended that Forex traders consider taking a short position with the AUD/CHF with a profit target around the 261.8% Fibonacci extension level.
TRADING ADVICE
Short Trade Setup:
Money Management Advice
For Account Size: US$ 1,000, position size should be 0.12 lots (mini)
For Account Size: US$ 5,000, position size should be 0.6 lots (mini)
For Account Size: US$ 10,000, position size should be 1.2 lots (mini)
Orders
Stop Loss: 0.7110
Take Profit: 0.6760