RSI Help! - Newbie Needs help switching to MT4 from FreeStockCharts.com
Did you try to tweak RSI Filter from here?
Howdy NewDigital,
Downloaded the file and read the thread... Sounds interesting... I will also read the article
It doesn't quite match up with FSC's RSI but i'll keep reading and see how it goes.
Thanks for the reply
and thanks to those who spend the time to code and share their work; it really benefits the rest of us who are non-coders.
Cheers!
-anbus01
Hi anbus01,
I knew that it is not the same what you are looking for.
But it may be something which can be modified by coders to meet your requirement for example.
I hope - some one will help using this or other examples.
...
anbus01
Is there a math formula published for that RSI somewhere?
Judging from the way it reaches 0 and 100 levels it could be Cuttler's RSI (this one : https://www.mql5.com/en/forum/178733/page17 ) made to show histogram instead of lines (here is an example with lines on the same daily chart - value 0 at May 25 too - was just guessing what price is used
...
To make the similarity more obvious, here is a Cutller's RSI made to show histogram. Without knowing the math formula, this looks the closest to the example (differences in RSI values can be due to price differences - it is enough that they have different GMT zone and daily chart would be different)
Hi anbus01,
I knew that it is not the same what you are looking for.
But it may be something which can be modified by coders to meet your requirement for example.
I hope - some one will help using this or other examples.Just grateful that there's a community that does this sort of stuff.
I actually tried the mq4 in the thread and I might use it too; it might help keep me in a long uptrend for a particular stock;
thanks for the ref.
To make the similarity more obvious, here is a Cutller's RSI made to show histogram.
Genius!
Couldn't get back right away because of work issues; but I will definitely be trying this out.
I will try to contact FSC though their number on their page and see they can give out formula.
Will try it out and see
Thanks a bunch!
Hello mladen,
Tried the mq4 with Jan 2011 data instead since it seems to work best in uptrends.
The Cuttler mq4 and the FreeStockCharts version are identical when RSI is 0 and the first uptick from zero. (signalling a buy). The values are identical when in that kind of "trend".
But some bars register a different value however, i.e. when the FSC version is at a 100, the Cutler mq4 registers 50 instead.
(In the FSC version, I think if RSI = 100 (or is it range between between 100 and some number?), then the first downtick from 100 signals a SELL.
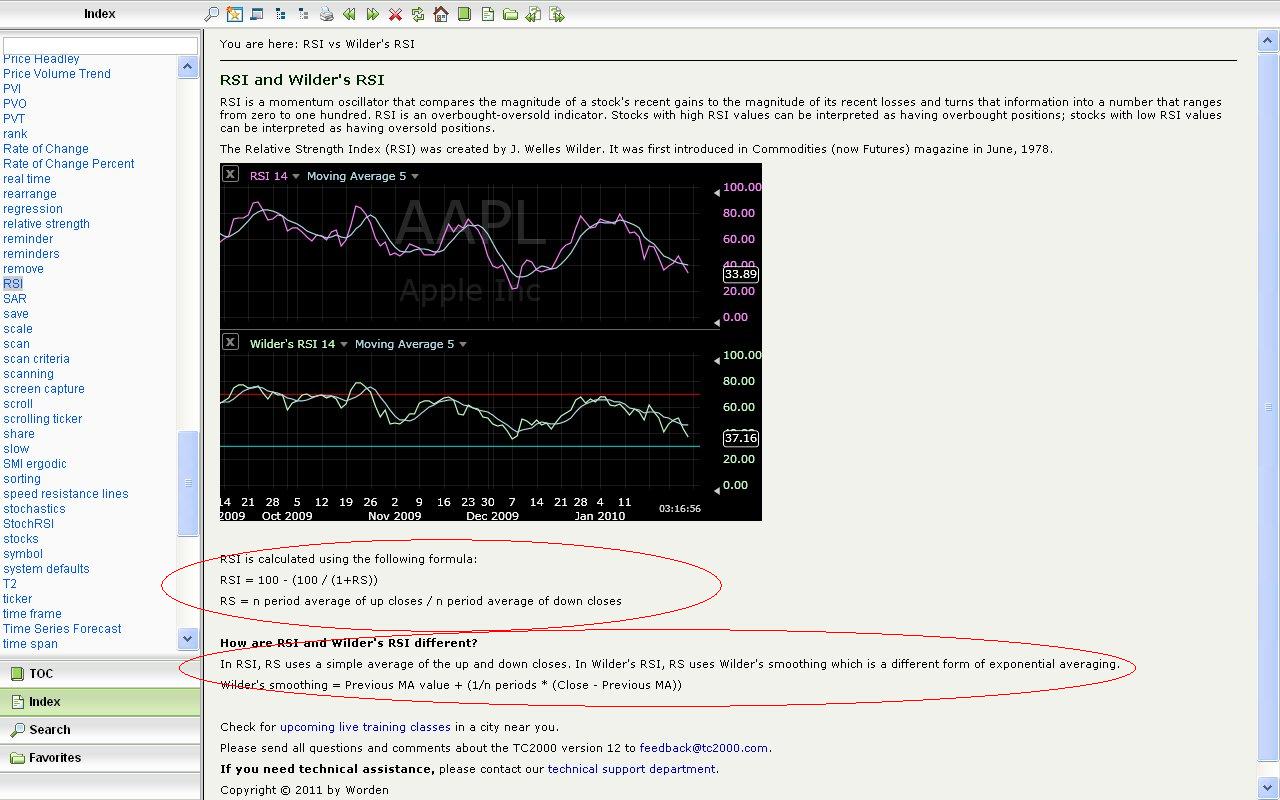
I looked at the help section of FSC and maybe found the formula for their RSI; don't know enough to verify; but here is the screenshot.
- Free trading apps
- Over 8,000 signals for copying
- Economic news for exploring financial markets
You agree to website policy and terms of use
Howdy folks!
Just thinking about switching to MetaTrader 4 from FreeStockCharts.com ("FSC"); but I've run into a snag.
I've gotten MT4 to duplicate all the indicators in FSC; except for the RSI Histogram. even in non-histogram form, FSC's RSI just seems to behave differently. don't know if this requires a "custom".
I'm a beginner, so any help in making this transition would be great...below this message are details.
Anyway thanks for sharing your knowledge and expertise on RSI.
-anbus01
***********Details below*********************
Details:
Anyway, Here's a screenshot of FreeStockCharts's RSI Histogram.
So the "RSI Histogram" can register a zero value as shown in the screenshot. ... when the histogram goes from a zero bar (like on the 25th of May ) to an "uptick" the next trading day (after the weekend) (on the 28th of May); - then it can be interpreted by the user as a "BUY" signal.
I've tried playing around with some of the following custom RSIs found on this thread:
https://www.mql5.com/en/forum/general
Namely, BLUR71's "RSI HistoAlert.mq4" and "RSI HistoAlert v2.mq4"
But being a novice to tech analysis; I don't really know how to tweak them so they match the one on FSC.
Can any of BLUR's customs above be tweaked to match FSC's RSI or...
...would this require the creation of another custom mq4?
Again thanks for your input.