Advanced Suggestions for Trading System
Forum have a similar thread on Public and Elite section:This thread is for Advanced Elite section.
Same idea as with others: if you have a good idea for a Trading System? Post here and we will try to develop it (all ideas will be evaluated first of course).(I stole all of that) 
Thanks for starting this thread Max want to share a little something been noticing from the dynamic zone indicators, been noticing it more lately with the latest double dynamic zone day impulse. What i am referring to is the squeeze effect before big moves similar to bollinger bands deviation, seems the closer the lowest and highest line are together the bigger the move, going on now on Gbp/Usd and Gbp/Jpy on M15 chart, check it out may be worth your time. 
Yes MrTools
I see you and thanks for coming through I have something myself I got stirring up in the pot although it's not quite ready to be brought to anyone's full attention  ,there is something about these indy's indeed though,they are truly,a sight for sore eyes
  LOL, no seriously though with the function of being able to interpolate higher timeframes i'm not scared to pull the trigger anymore and it truly gives one confidence to trade under the H1 timeframe which is supposed to be like forbidden or for professionals only at least! but on to your evaluation if we observe the pic uploaded we can see a potential setup of which you described mrtools "seems the closer the lowest and highest line are" on the eur/usd m15 the H1 day impulse are tightly squeezed together plus it crossed it's zero line and also the 30m normalized deviation crossed it's 0 line,but let's see what happens with the 200ma the white line and the round number 1.2950 and oh yeah today's friday alot of people I heard don't trade on fridays and even sunday night some take off ,like even being amongst the advanced elite of indy's I'm still a caveman for some old school rules!
  but all in all you have good eyes catching this setup and it's only been about a day since these versions have been up running! great work and I will watch in future for more like it,thanks mrtools
P.S I've noticed already even with predecessor versions that sometimes the H1 daympulse will cross it's zero before the 30 min deviation will cross it's zero which I think is good but sometimes the vice versa will happen in which the 30m deviation will cross it's zero before the H1 crosses it's zero, either way I think it's good very good signals being produced follow them either way they go whichever one cross first just always make sure whichever one crosses it's zero first if not already wait for impluse ma's to cross and agree in same direction as zero cross on other indy and your good to go,( hopefully no one's confused and I explained that correctly) also keep in mind since these version's zero lines are dynamic we are getting way better signals than last versions,but I will definitely keep eye on progress of these two indy's together next week,cheers and happy trading
The tight band move
so mrtools what will you call this setup?I already thought of something maybe it should be called the tight band move,"seems the closer the lowest and highest line are together the bigger the move" starting off this week on eur/usd 15m chart,the h1 dayimpulse were tightly squeezed together since friday,now around 170 pips later it''s going be exciting to see what happens next time bands come close again,this might be worth some more attention,thanks mr tools
Historic Weekly Levels
I read a long time ago a book about commodities called "The Insiders Profit Matrix",and I yes I know the proper way to start off was,A long time ago I read a book about commodities called,blah,blah,blah,blah. the point is I always remembered it because it was the first book i ever read about trading any sort of instruments,needless to say the main point the guy was describing as a method was to sell off 20 year highs and buy up 20 year lows( sorta like the turtles 20day thing they had going on) but since this book I believe was wriitten in the 90's I suspect anyone using that setup after the year 2000 was turned into cannonfodder after what happened to the economy,but what does this got to do with today? you ask?please take a moment to observe 2nd pic,notice all them weekly open,high,low and close levels? all those levels were produced from 4/1 through 4/29,I bet my friend 1000 bucks price wouldn't bust through all them levels, and he mumbled something about fundamentals and went ahead and bet me anyway so around 300 pips later I'm the clear winner,but the reason behind the mention of this is that if we take a look at 3rd pic we can see starting this week there wer only 2 levels to gauge which price is about 170 pips away from that is the 5/6 close and 5/6low,but be wary of some crazy levels coming up if you notice 1st pic,it should be fun to see how price reacts around 1.2524 and 1.2587
P.S this weekly levels suggestion may not be so advanced to some but to others who don't know,now you know,pay them close attention because against the grain me personally I use 8 lot orders any time price acts up around the 200 ema along with a previous level weekly line together nsync it's like a really high probability entry,is all I'm saying,cheers and great trading to you all
so mrtools what will you call this setup?I already thought of something maybe it should be called the tight band move,"seems the closer the lowest and highest line are together the bigger the move" starting off this week on eur/usd 15m chart,the h1 dayimpulse were tightly squeezed together since friday,now around 170 pips later it''s going be exciting to see what happens next time bands come close again,this might be worth some more attention,thanks mr tools
Could call it that i guess
Momentum
I noticed something happening with this polychromatic indy,it's a pretty cool indy,with a pretty cool name! Guess that's why I kept dabbling around with the settings on my charts,but here's are probable entries I found using this unique momentum strategy:
I have the old non dynamic version with settings applied to red=20,orange=40,green=80,(kinda makes me think if it's better off like the mutiple dtosc was,this is just a thought though!)and on the bottom window is new dz indy with settings on 120,Now if we take a look we can clearly see when the 20 crosses the 80 and price stills goes counter it's sorta like polychromatic divergence! ,always confirm these crossings with whatever side the dz version settings 120 is on of course for the longer term outlook,in particular look for what side of the zero it's on like in pic attached I took a buy because also the 20,40,and 80 were far apart something too look for,and the dz 120 had crossed it's zero,it didn't hurt neither the tma centered was coming up out of sell zone and started pointing up I have tma settings PA filter 3.0,PA cycles 6.0,Buy P1-0.009,Buy P2 0.25,Sell P1 0.009,Sell P2 0.25(thanks mrtools!)
This is a setup which I've noticed it's has potential for eyes to keep a look out for! ,Peace and happy trading Max
Momentum updated
1st position 273 pips
2nd "" 221 pips
3rd "" 213 pips
4th "" 194 pips
5th "" 148 pips
6th ''" 60 pips
7th "" 55 pips
8th """ 52 pips
9th "" 48 pips
10th "" 6 pips
1270 pips off a 273 pip ride on 10 trades
First off I know this week was a super news week but I just wanted to show the potential of this strategy in a strong trending move,using same settings as stated in last post only thing different you should notice is I added the fixed zero line{gold line} to the DZ PM{Polychromatic Momentum}!! I know it's sounds crazy right? But I did it just to see what would happen and sure enough look at what we have here my digital trader buddies!
There are times when the top of the dz pm buy zone will sync up with the fixed zero! and I took this alone as resistance because look at how price will either fail to attempt to make a new high or it's a fake out and at the same time the dz 120 pm will either bounce off the n synced buy zone with fixed zero and go lower or it will go above just a little{like a fakeout would and should} and come back under both levels{n synced bz and fixed 0}so when price breaks the lowest low on the pullback/retrace it's the sign to add on.
I hope I explained it right because following what price and indy's are telling us allows one to not be scared any longer to add on trades,now I know this may not be everyone's cup of tee because we have conservative traders,aggressive traders and traders right in the middle that use medium risk we can call them lukewarm traders! but to those interested,even take a look at how the tma bands alone{mr tools settings from above post,it doesn't slope or bend so easily I noticed this through watching it over time only on strong moves like this will it form this arc{h}}just look at it the beautiful arc{h} the bands makes reacting to price and how price reacts to the levels on the bands like i honestly believe that is the truth to our thing about certain indy's and why some people are fascinated with them{and look at custom indys being created and presented like christmas presents in the morning which will make fx-tsd,Santa! all year round! ha,ha,lol} it's because sometimes it does look like a portrait or picture or truly a work of art,"what price does and how indys reacts and then how price reacts to what indy's are doing!" There I said it! I feel it's the truth too no lie with all my heart,but it get's better to ya'll because if we can truly decipher the meaning behind what the portrait is trying showing us{da vinci mirror drawings},then that means we can make little money!,Heh how bout that sounds nice right,so now if you get it and you got it you should be good,now.
And for the Regular version of Pm when the 20,40 and 80 are tied together expect a move when they become untied{20 crosses 80} the move is potentially exhausted not meaning it will reverse in other direction automatically it only means to watch what price does and if in a position already move stop loss up to wherever you see fit,because a price spike can collapse your trade or we're in for another ride meaning time to add on{get it},
All in all I think the pic states a lot to be learned trading this setup but not just in a strong trend either,I personally believe it performs better intraday,but it sure does know how to spot the good moves either way and oh yeah almost forgot I know it's easier to sell than buy that's why I'm working on a system where I only take sell trades on pairs with good swap because I like to add on trades if possible like I don't mind holding a trade if the market will let me I have the privilege of being my own trailing stop only because I can monitor it like that! And almost forgot to mention the buy rules will simply be reversed and I also had a feeling to keep adding on cause there was tough resistance on W1 and D1 showed a certain known pattern{DT} starting on 7/1
Here's Little Something
I've learned something about trading systems since everyone is different,alot of the times the whole strategy will come off as discretionary although the the user who posts may claim to be successful already with it,I believe it's because you can only tell someone how you would trade a system and then imply if you will trade it this way on a certain timeframe with these indy's lining up etc... then this is what you will expect because the user has already presented it as battle tested and time proven etc.. I started thinking about what if I just post a template with simple rules then say this is how i would trade this,then step back and say but however way you see fit you can play with it yourself and see what you can come up with,meaning my simple 3 step rules can have other entries I missed not even counting the tweaking of the settings variable!
So from now on this is how I will present a strategy I believe is worthy to be mentioned for anyone who may find this useful,I trade these indicators this way,but however way you may see fit,try to do what you can do with this there's a little something happening with it,I mean the alignments:
Indy's used on this 15m chart are OnChart Rsi 2- one on a period 14(pink line,dark gray bands) and another on a period 21(Lime line,Brown bands) ,both RsiMethod are 4 the T3 hot is 0.618 I use this setting for all my T3 hots ,H1 settings for both also
Blau-erodic tsi bars 2- ColorOn 1 M30 settings
StepChart_v1(1)- step size 20(I watched stepsize 15 also,it's not a bad indy at all,I will say,I like it)
CFB adaptive T3 CCi nrp_mtf- T3 hot same as before M30 settings
MFI T3 Smoothed nrp- T3 hot same as before H1 settings (yes this indy is overlayed with the CFB)
Alb QQE2 Advanced_alerts+arrows- swing count is 1 RsiMethod is 4 T3 hot is,you should know by now arrows on slope are the arrows you see H1 settings
Real quick a picture can tell a thousand words,price likes to bounce in between the bands until it's ready to make it's move,I won't suggest trading until it does so because usually when it does we're in for a ride!
First thing to look for is where the onchart 14 and 21 are then see which side of the zero your on if above only buy if below only sell now once the blau candles and step chart agree I have them same color wait for the MFI and QQE color to agree on the slope of the CFB CCI that's all enjoy.
Ps I included usd/cad to show how the bands sort of trap price when it ain't going no where aggressive entries will include entering when either onchart rsi come out of oversold/overbought zone,etc..whatever you may see happy trading
I've learned something about trading systems since everyone is different,alot of the times the whole strategy will come off as discretionary although the the user who posts may claim to be successful already with it,I believe it's because you can only tell someone how you would trade a system and then imply if you will trade it this way on a certain timeframe with these indy's lining up etc... then this is what you will expect because the user has already presented it as battle tested and time proven etc.. I started thinking about what if I just post a template with simple rules then say this is how i would trade this,then step back and say but however way you see fit you can play with it yourself and see what you can come up with,meaning my simple 3 step rules can have other entries I missed not even counting the tweaking of the settings variable!
So from now on this is how I will present a strategy I believe is worthy to be mentioned for anyone who may find this useful,I trade these indicators this way,but however way you may see fit,try to do what you can do with this there's a little something happening with it,I mean the alignments:
Indy's used on this 15m chart are OnChart Rsi 2- one on a period 14(pink line,dark gray bands) and another on a period 21(Lime line,Brown bands) ,both RsiMethod are 4 the T3 hot is 0.618 I use this setting for all my T3 hots ,H1 settings for both also
Blau-erodic tsi bars 2- ColorOn 1 M30 settings
StepChart_v1(1)- st
ep size 20(I watched stepsize 15 also,it's not a bad indy at all,I will say,I like it)
CFB adaptive T3 CCi nrp_mtf- T3 hot same as before M30 settings
MFI T3 Smoothed nrp- T3 hot same as before H1 settings (yes this indy is overlayed with the CFB)
Alb QQE2 Advanced_alerts+arrows- swing count is 1 RsiMethod is 4 T3 hot is,you should know by now arrows on slope are the arrows you see H1 settings
Real quick a picture can tell a thousand words,price likes to bounce in between the bands until it's ready to make it's move,I won't suggest trading until it does so because usually when it does we're in for a ride!
First thing to look for is where the onchart 14 and 21 are then see which side of the zero your on if above only buy if below only sell now once the blau candles and step chart agree I have them same color wait for the MFI and QQE color to agree on the slope of the CFB CCI that's all enjoy.
Ps I included usd/cad to show how the bands sort of trap price when it ain't going no where aggressive entries will include entering when either onchart rsi come out of oversold/overbought zone,etc..whatever you may see happy tradingMaxwell, can you post the setup. It looks interesting. And would like to learn more.
Ish
my trading system
hi ,
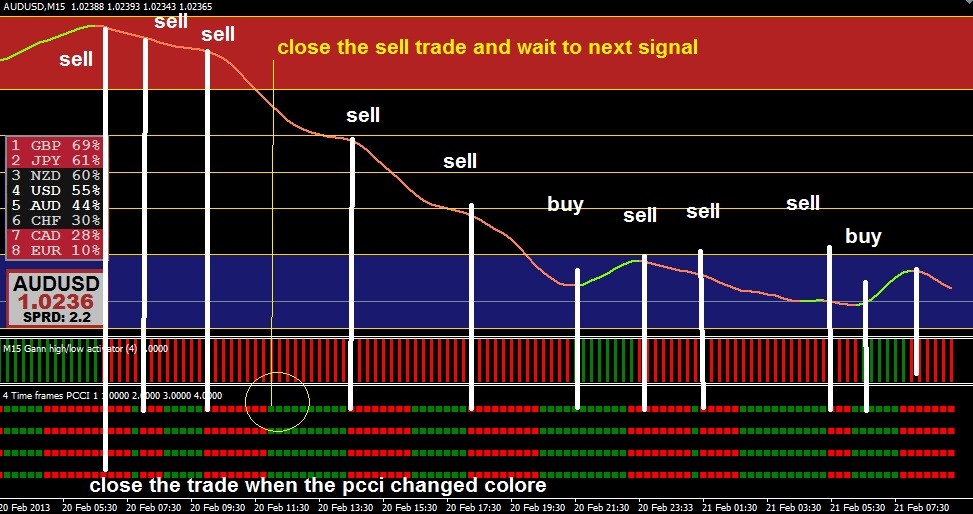
this is my trading system . i am using indicators which found in this forum and i hope it can help all of you in trading
i am using 15m trading time. and i am really get very good result using this system. you can try it.
i shared this system to return back all the help that provide to me from this forum.
thanks to all
picture explain how the system works and if there are any question please don't hesitate to write it here.
thanks to all in advanced elite section specially malden and mrtools
- Free trading apps
- Over 8,000 signals for copying
- Economic news for exploring financial markets
You agree to website policy and terms of use
Forum have a similar thread on Public and Elite section:This thread is for Advanced Elite section.
Same idea as with others: if you have a good idea for a Trading System? Post here and we will try to develop it (all ideas will be evaluated first of course).(I stole all of that)
Just thought it was about time this section had this type of sub forum finally,any takers?