Technical Analysis
Technical Analysis and Trading Recommendations
EUR/USD
June 27, 2011.
Expertise: Fundamental and Technical Analysis
Average Time Frame of Trades: 2 days to 5 days.
Pivot Point: 1.4212
The EUR/USD's subsequent sharp fall suggests that decline from 1.4430 and close at 1.4189. On the downside this week should break level of 1.4100 as a major Support.
Therefore, EUR/USD should be resuming the set of impulsive fall to 1.4040 as first target and continue towards 1.3980.
The best location for placing stop loss, if break in 1.4252 and close up the moving average (200).
Recommendations:
It will be a good sign to sell at 1.4215 with a first target of 1.4115 and continue towards 1.4000 for a week. Meanwhile it should care
of level 1.4252 since if it breaks, it will be a good sign to buy, it might resuming to 1.4400.
EUR/USD
June 28, 2011.
Pivot Point: 1.4227
As expected, the EUR/USD couldn't break the major support level at 1.4100 for that the pair has rebounded on its support,
it might resuming to 1.4400. With a 1.4415 minor resistance if won't break easily then will know a range day between 1.4415 and 14215.
R3 1.4542
R2 1.4418
R1 1.4351
PP 1.4227
S1 1.4160
S2 1.4036
S3 1.3969
Signals:
1. Below 1.4415 look for further downside with 1.4300 and 1.4230 targets.
2. Buy positions above 1.4415 with target 1.4502.
Technical Analysis and Trading Recommendations
EUR/GBP
June 29, 2011.
Expertise: Technical Analysis
Average Time Frame of Trades: 1 days to 3 days.
Pivot Point: 0.8965
The EUR/GBP has rebounded from a strong Resistence at 0.9020 (in May 5, 2011 at 08:00 GMT+2), it is now approaching its resistance around the spot between 0.8990 and 0.9040, it will probably start downside movement at this area and recovery again. Moreover the RSI calls for a new whole decline. Therefore it should ask for a high price to sell at this spot with a first target of 0.8940 and continue towards 0.8875 On other hand if a break in 0.9125 will be a good location for placing stop loss
Recommendations:
Short Selling at 0.9000 / 0.9040
Take Profit at 0.8880
Stop Loss at 0.9115
Technical Levels:
R3 0.9063
R2 0.9024
R1 0.9004
PP 0.8965
S1 0.8945
S2 0.8906
S3 0.8886
Technical Analysis
EUR/USD
June 28, 2011.
Pivot Point: 1.4227
As expected, the EUR/USD couldn't break the major support level at 1.4100 for that the pair has rebounded on its support,
it might resuming to 1.4400. With a 1.4415 minor resistance if won't break easily then will know a range day between 1.4415 and 14215.
R3 1.4542
R2 1.4418
R1 1.4351
PP 1.4227
S1 1.4160
S2 1.4036
S3 1.3969
Signals:
1. Below 1.4415 look for further downside with 1.4300 and 1.4230 targets.
2. Buy positions above 1.4415 with target 1.4502.Technical Analysis.
EUR/USD
June 30, 2011.
Pivot Point: 1.4402
H4:
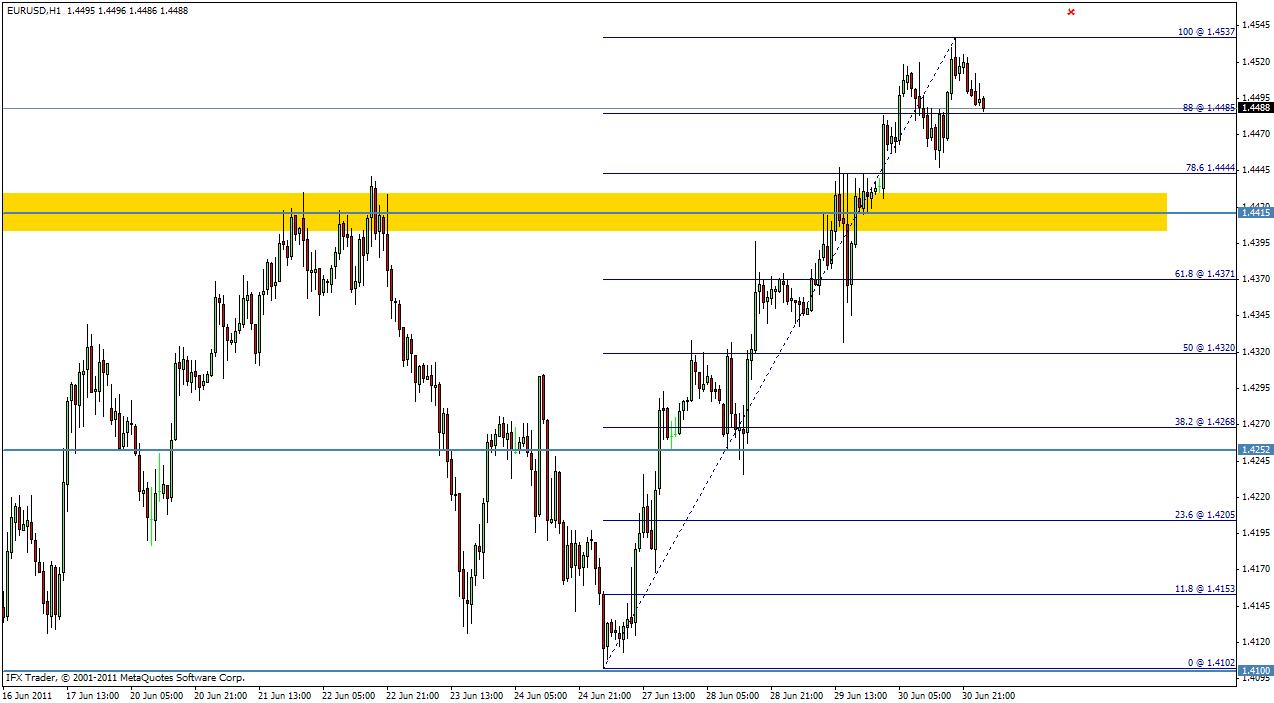
EUR/USD: The market continues to show signs of strength following the break above 1.4415 Resistance and close at 1.4433.
Therefore it will be turned to a minor Support. In such case, stronger rise should be seen towards 1.4535 Resistance for confirmation.
Moreover the trend is still above 50% Fibonacci retracement level, thus it will be a good sign to buy above 1.4400 and sell below 1.4360.
Daily:
(1.4100 has called as a major Support, in June 27, 2011.)
The EUR/USD's choppy rise from 1.4100 extended further last April 2011. Nevertheless, downside momentum is rather convincing and the structure of fall looks to test 1.4141, after reach the trend around 1.4500/1.4550.
Technical Levels:
R3: 1.4598
R2: 1.4522
R1: 1.4478
PP: 1.4402
S1: 1.4358
S2: 1.4282
S3: 1.4238
Technical Analysis and Trading Recommendations
EUR/USD
July 1, 2011.
Expertise: Technical Analysis
Average Time Frame of Trades: 1 day.
Pivot Point: 1.4489
EUR/USD: According to previous events, the market still continues to show signs of strength following the break above 1.4415 Resistance. And the Resistance has now become Support, therefor the market indicates a Bullish opportunity above 1.4515 after wards. Moreover on Daily chart the RSI calls further upside in short-term from the level of Support is still progress and would probably target 1.4535 and continue toward 1.4600. However, the best location for placing stop loss below 1.4400.
Technical Analysis and Trading Recommendations
NZD/USD
July 4, 2011.
Pivot Point: 0.8277
Daily:
Overview:
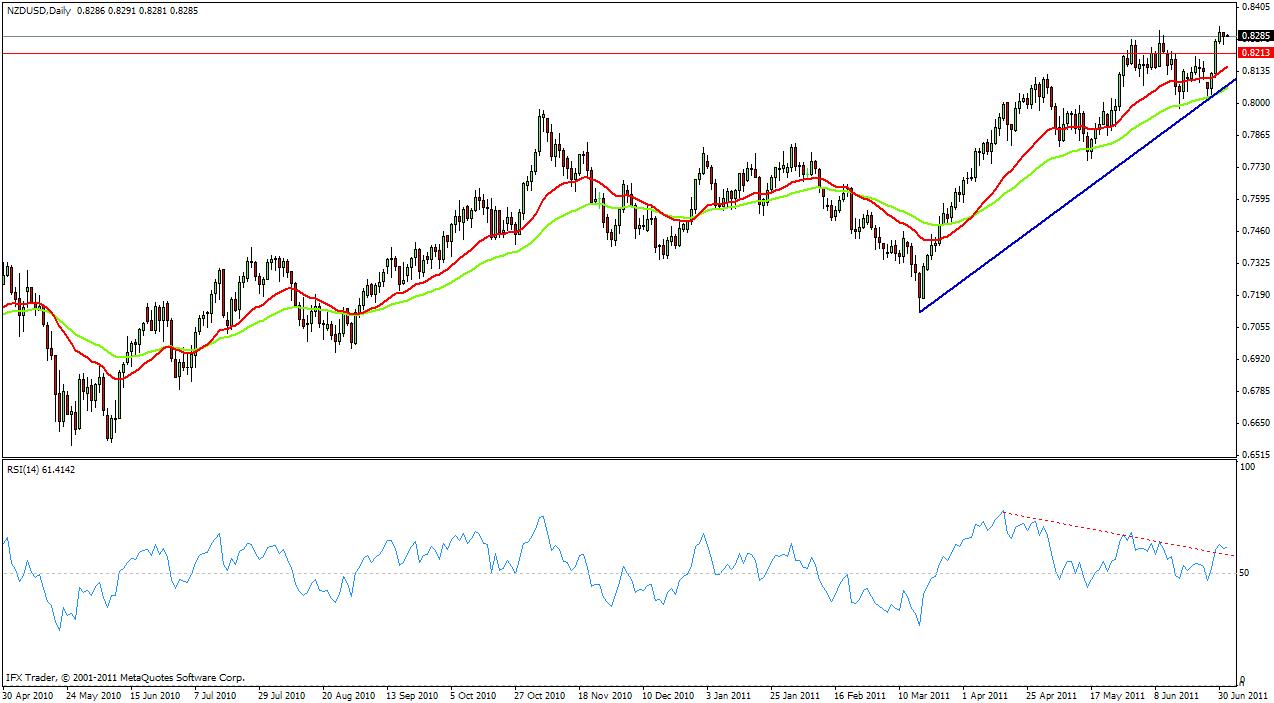
The NZD/USD has continued straight from 0.8200, hence the Kiwi is shown signs of strenght following the break of the highest level of 0.8213 and open today above the pivot point (0.8277), thus it will be a good sign to buy above the level of 0.8213 with a first target of 0.8333 and futher to 0.8380. However, in case of reversal takes place and the NZD/USD breaks through the Support level of 0.8200 then the market will lead to futher decline to 0.8125, in order to indicating the correction movement. Moreover should note a point of view that the EMA25 (Red) have to cross over the EAM50 (Green), it would be more of a confirmation for downtrend.
July 5, 2011.
Strategy # BR/S #
Currencies Pairs: All
Frame: H1 and/or H4
All traders have to know two important points in trading:
1. Buyers are BIDding at a lower price.
2. Sellers are ASking for a high price.
Through those points is evident that profit is buying cheap and Selling at a high price, thus it should care too much about the entry of the peaks and/or bottoms.
1st Case: #BUY#
Look at the graphic time frame H1 and determine the last three Supports since a week.
Support1
Support2
Support3
The best accurate breakout level for BUYing trade at: (Support1 + Support2 + Support3)/3 + 0.0020
If the trend is strong to breakout 20pips the level that already found, it does mean: it'll continue and it's a good breakout trade and not a fake one.
Taking Profit:
We have to place Take Profit at 25pips below the top Resistance3.
Stop Loss:
The best location for placing Stop Loss is: 20pips below the last swing low.
Note: Take Profit = 5/3 * Stop Loss
Example:
If the Stop Loss is 75pips, then:
Take Profit = 5/3 * Stop Loss
Take Profit = 5/3 * 75pips
Take Profit = 125pips
Confirmation:
We Drag the Fibonacci from the Resistance3 to Support3, if our level is around 38.2% Fibonacci Retracement, it is a good convincing proof to BUY.
Technical Analysis and Trading Recommendations
GBP/USD
July 6, 2011.
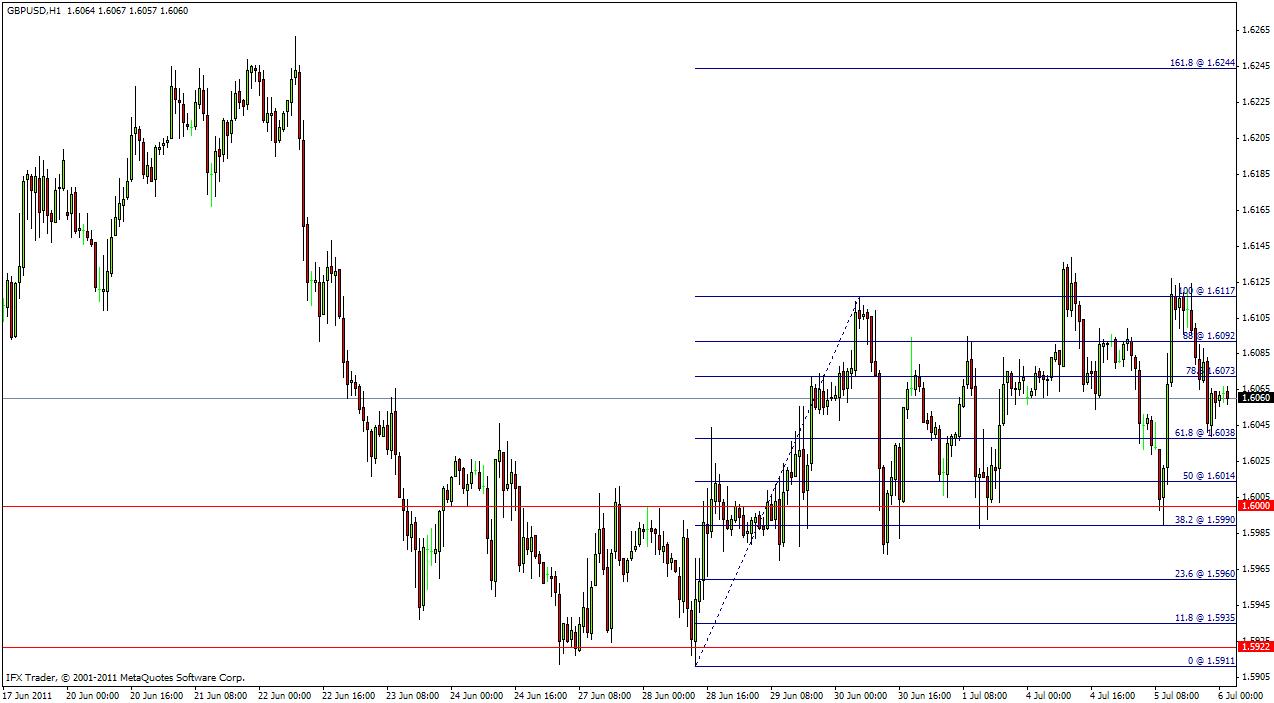
Yesterday Historic (July 5, 2011 - Note: we use historic prices to determine future prices)
Open 1.6089
High 1.6127
Low 1.5990
Close 1.6062
We have found:
Pivot Point: 1.6060
OCTO= * 100
OCTO = 50.2133
Volatility= Average * Rang
Test the Volatility, if use 1lot with leverage of 1:200.
Then the Volatility is 220.0015 that does mean the trend's movement is enough strong, moreover the trend is still above the 50% Fibonacci Retracement is .
Look at the chart:
50% Fibonacci Retracement = 1.6014
Recommendations:
1. Buy positions above 1.6040 with a target of 1.6120, then if a break the peak point at 1.6140 it might resuming to 1.6210.
2. Closure below 1.6000 would invalidate this outlook..
Technical Levels:
R3: 1.6266
R2: 1.6197
R1: 1.6129
PP: 1.6060
S1: 1.5992
S2: 1.5923
S3: 1.5855
Short Overview:
The GBP/USD has rebounded from a minor Support at 1.6047, and it is now approaching its Support, it will probably start upside movement at this area and recovery again. Therefore it will a good sign to Buy at this spot with a first target of 1.6120, and continue towards 1.6200. On other hand if a break in 1.6000 will be a good location for placing stop loss below 1.5992 (Support 1).
July 5, 2011.
Strategy # BR/S #
Currencies Pairs: All
Frame: H1 and/or H4
All traders have to know two important points in trading:
1. Buyers are BIDding at a lower price.
2. Sellers are ASking for a high price.
Through those points is evident that profit is buying cheap and Selling at a high price, thus it should care too much about the entry of the peaks and/or bottoms.
1st Case: #BUY#
Look at the graphic time frame H1 and determine the last three Supports since a week.
Support1
Support2
Support3
The best accurate breakout level for BUYing trade at: (Support1 + Support2 + Support3)/3 + 0.0020
If the trend is strong to breakout 20pips the level that already found, it does mean: it'll continue and it's a good breakout trade and not a fake one.
Taking Profit:
We have to place Take Profit at 25pips below the top Resistance3.
Stop Loss:
The best location for placing Stop Loss is: 20pips below the last swing low.
Note: Take Profit = 5/3 * Stop Loss
Example:
If the Stop Loss is 75pips, then:
Take Profit = 5/3 * Stop Loss
Take Profit = 5/3 * 75pips
Take Profit = 125pips
Confirmation:
We Drag the Fibonacci from the Resistance3 to Support3, if our level is around 38.2% Fibonacci Retracement, it is a good convincing proof to BUY.2nd Case: #SELL#
Look at the graphic time frame H1 and determine the last three Resistances since a week.
Resistance1
Resistance2
Resistance3
The best accurate breakout level for SELLing trade at: (Resistance1 + Resistance2 + Resistance3)/3 - 0.0020
Taking Profit:
We have to place Take Profit at 25pips above the top Support3.
Stop Loss:
The best location for placing Stop Loss is: 20pips above the last swing high.
Note: Take Profit = 5/3 * Stop Loss
Example:
If Take profit is 195pips, then:
Take Profit = 5/3 * Stop Loss
Stop Loss = (3 * Take Profit) / 5
Stop Loss = (3 * 195pips) / 5
Stop Loss = 117pips
Confirmation:
We Drag the Fibonacci from the Resistance3 to Support3, if our level is around 78.6% Fibonacci Retracement, it is a good convincing proof to SELL.
Technical Analysis
GBP/USD
July 7, 2011.
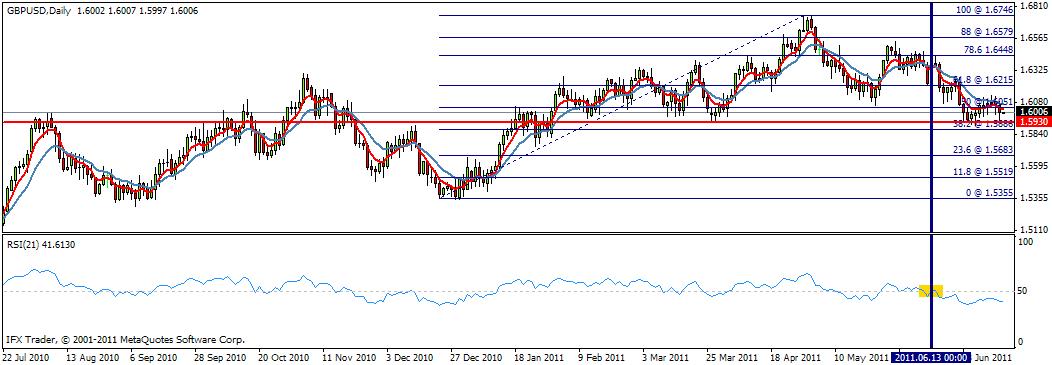
Psychological Level at 1.5930
Overview:
The GBP/USD's subsequent sharp fall suggests that decline from 1.6448 and had resumed to 1.5957 yesterday. And it is now approaching from the psychological level of 1.5930, moreover, it is also between the 50% Fibonacci Retracement and 38.2% (daily chart). If the trend will break this level and closure below it, then it will be a downside momentum is rather convincing and the structure of the fall looks is not corrective, therefor the market will indicate a Bearish opportunity below 1.5930 then the Support will be become a Resistance, hence it will a good sign to Sell below 1.5930. Meanwhile, if the pair can't break this level, it will probably recovery and choppy rise from this level extended further next days, for that it will be a good sign to buy above 1.5960.
- Free trading apps
- Over 8,000 signals for copying
- Economic news for exploring financial markets
You agree to website policy and terms of use
Good morning,
In this post, will share some Technical Analysis and Signals daily.
TECHNICAL ASPECT
Numerical analysis: Probabilities, equations/Formulas and techniques of applying Fibonacci levels.
Classical analysis: Breakout startegy and trend indicators.