Brooky Indicators - page 6
You are missing trading opportunities:
- Free trading apps
- Over 8,000 signals for copying
- Economic news for exploring financial markets
Registration
Log in
You agree to website policy and terms of use
If you do not have an account, please register
Tsar Set the see_all_prices to true and you will get something like this on the picture
Thank's mladen.
I need these Indie can Calc Fibo's like in the Picture in Post #41 or codebase.mql4.com/7206
Where's HIGHEST & LOWEST Lines missing ???
Would you like Fix it, please...
Tsar
There are no missing lines. On both examples I see there are 7 levels.
What seems that you are trying to place 2 on a same chart and in that case it will not show all labels. Here is a version that can have more than one on a same chart. Set the UniqueIDparameter to unique value for each instance and then you can have as much instances as you want on the same chart
Thank's mladen.
I need these Indie can Calc Fibo's like in the Picture in Post #41 or codebase.mql4.com/7206
Where's Lines missing ???
Would you like Fix it, please...Tsar
There are no missing lines. On both examples I see there are 7 levels.
What seems that you are trying to place 2 on a same chart and in that case it will not show all labels. Here is a version that can have more than one on a same chart. Set the UniqueIDparameter to unique value for each instance and then you can have as much instances as you want on the same chartFinally found the solution... with placeanother Brooky_Fibbed_Donchian's indie.
Added with changes Calculation Inner Line Fib Levels in Setting_3
Thank's so much for your Help...
Updated Parabolic SAR Levels Indicator
Hi all,
Had some time to add extra levels to a levels indicator that I have found very useful over the years.
I prefer M30 as a TF so this sits well with defaults on that TF.
The indicator is a good backdrop for other confirmations and confluence of levels are generally powerful support or resistance.
Noticeable are the swings at the changes of most psar before a reasonable move.
Cheers
Brooky
Update to above Psar Levels indicator. It was leaving lines on chart when flicking between time frames. This has been fixed.
Cheers
Brooky
If this request is not proper please forgive my indiscretion.
Would it be possible to code a "for EA" style indicator from the attached file - a la "deviations for EA", with smoothing etc.? (slope up equals 1, slope down equals -1)
Thank you.
I deleted this post.
I have since posted this to the Elite section. Sorry for any confusion.
Thank you.
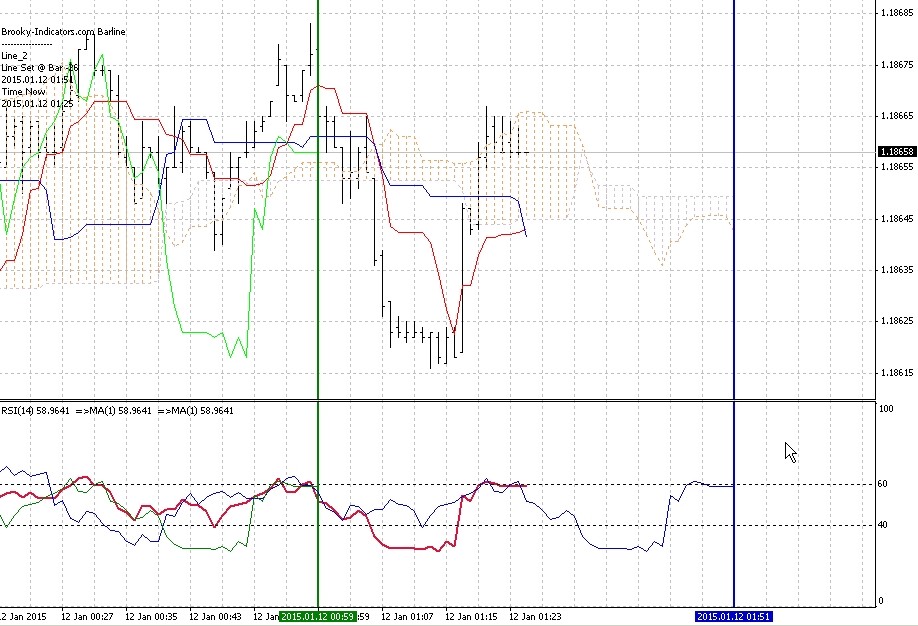
Ichimoku Visual Aid
A fellow trader asked for this and I believe it is a handy little indi to make available.
This indicator will plot a following vertical line at whichever bar (past or future) that you elect to assist in seeing where shifted values fall vertically on a chart.
Two or more instances can be placed on a chart by changing the unique name of each instance.
Useful for Ichimoku in particular or any other indi that has shifted plots you want to track over a subwindow indi.
Pic is just an example of two lines +26 and -26 bars with standard ichi and standard Rsi below that has a 2 x shited MA1 applied to it at the -26 +26 bars.
Hope you find it useful.
cheers
Brooky
brooky_barline.mq4