Pearson (lienar) correlation
Additional info on Pearson (linear) correlation can be found here : Correlation and dependence - Wikipedia, the free encyclopedia (along with some info on Kendall's tau and Spearman's rank correlation)
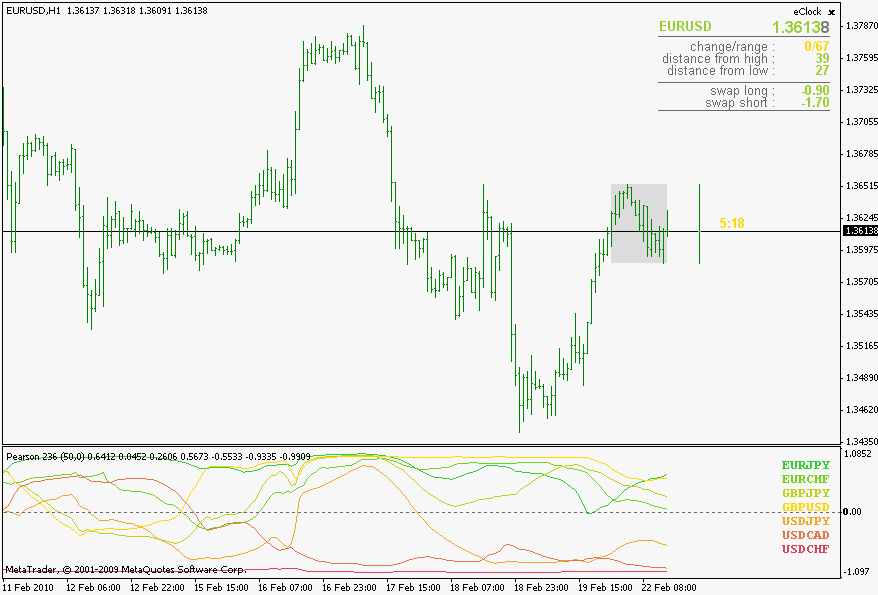
Examples :SubType 0 :
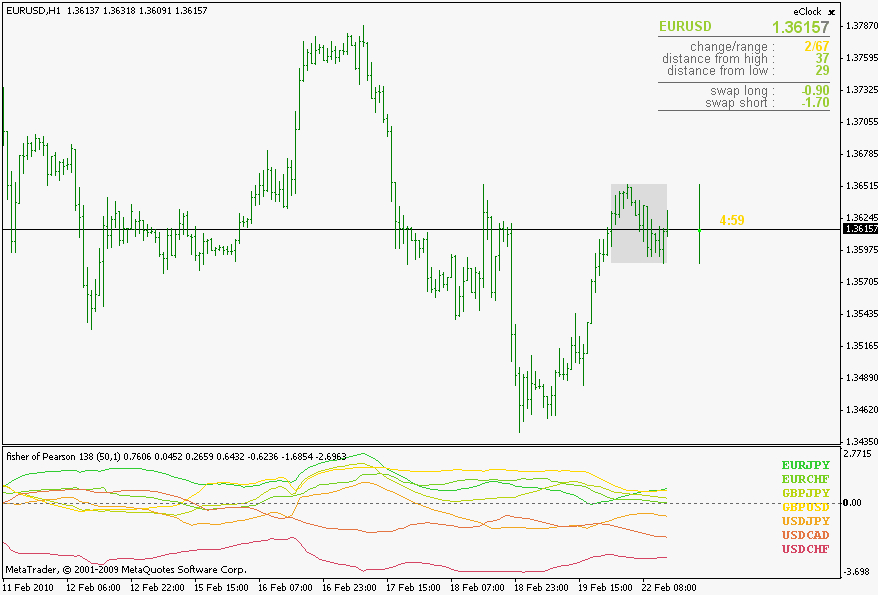
SubType 1 :
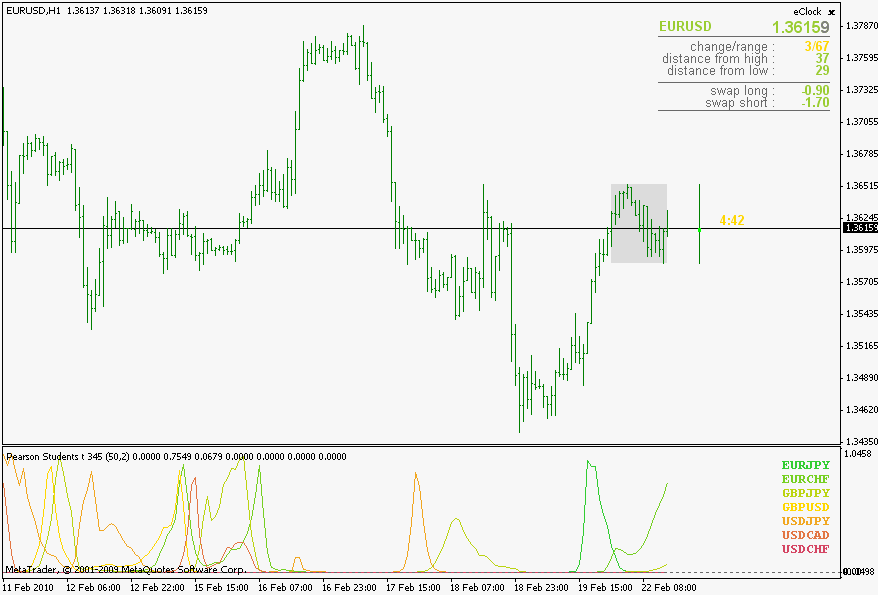
SubType 2 :
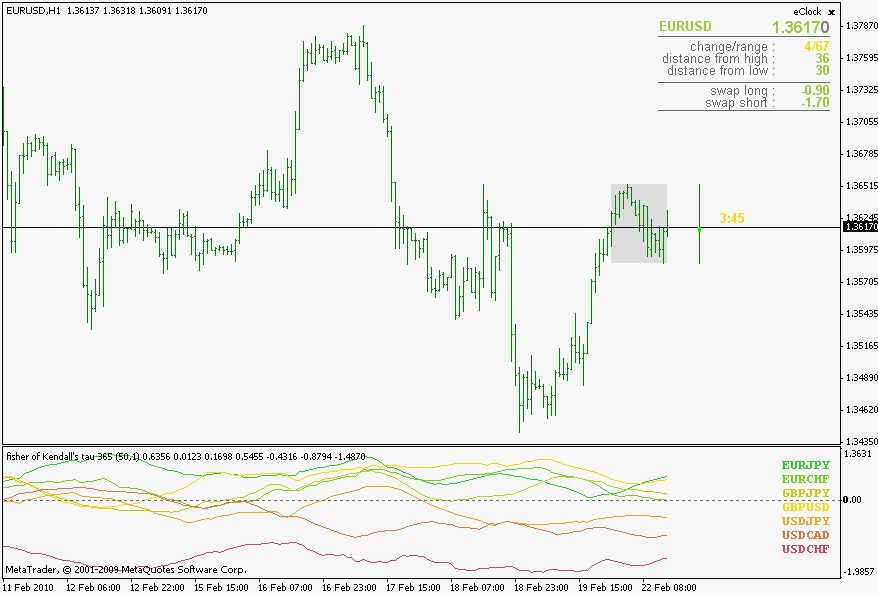
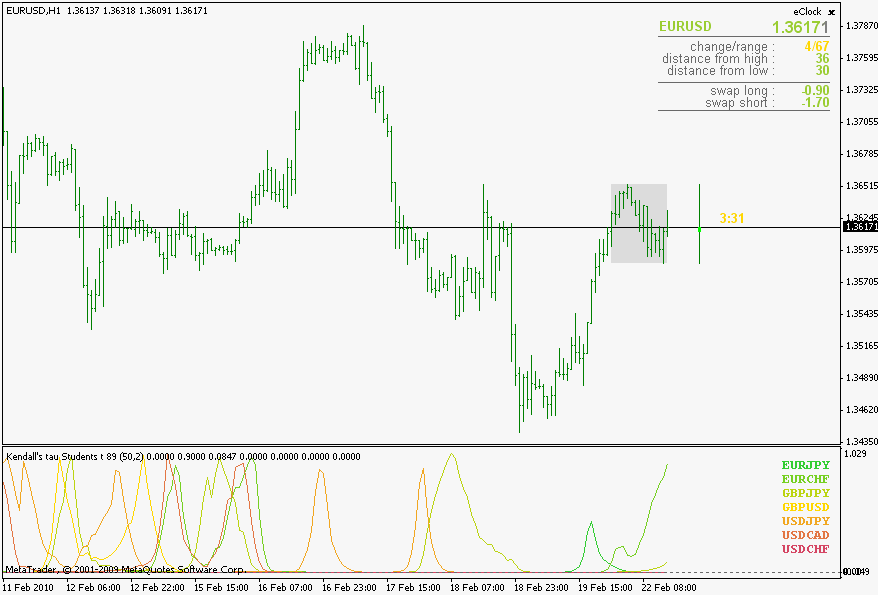
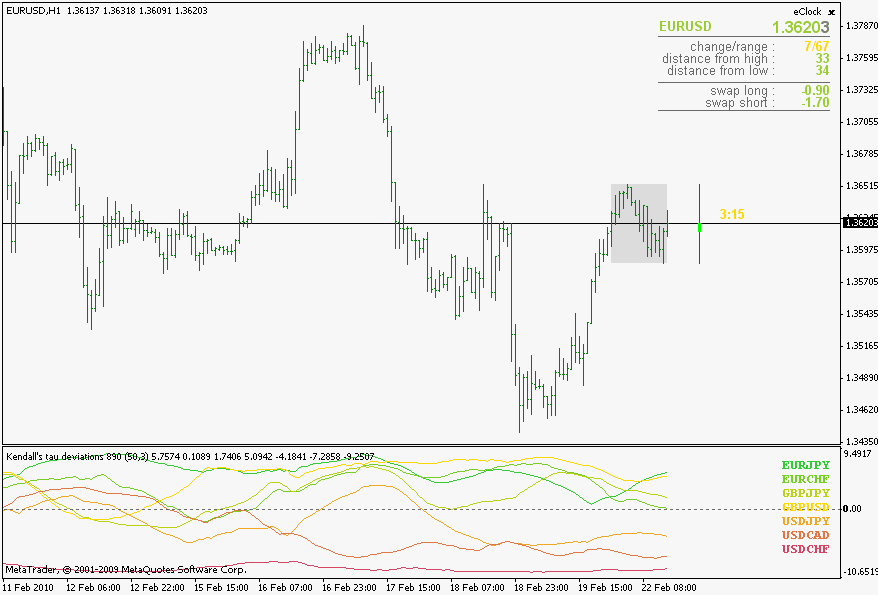
Kendall's tau
Some additional information can be found here : Kendall tau rank correlation coefficient - Wikipedia, the free encyclopedia . A word of warning regarding Kendall's tau : it is a n squared complexity algorithm, so do not use very long lengths or you might end up drinking coffee while waiting for it to calculate values 
But after reading this article : http://www.rsscse.org.uk/ts/bts/noether/text.html I decided to have it here in the correlations regardless of it's complexity and definitely for comparison reasons
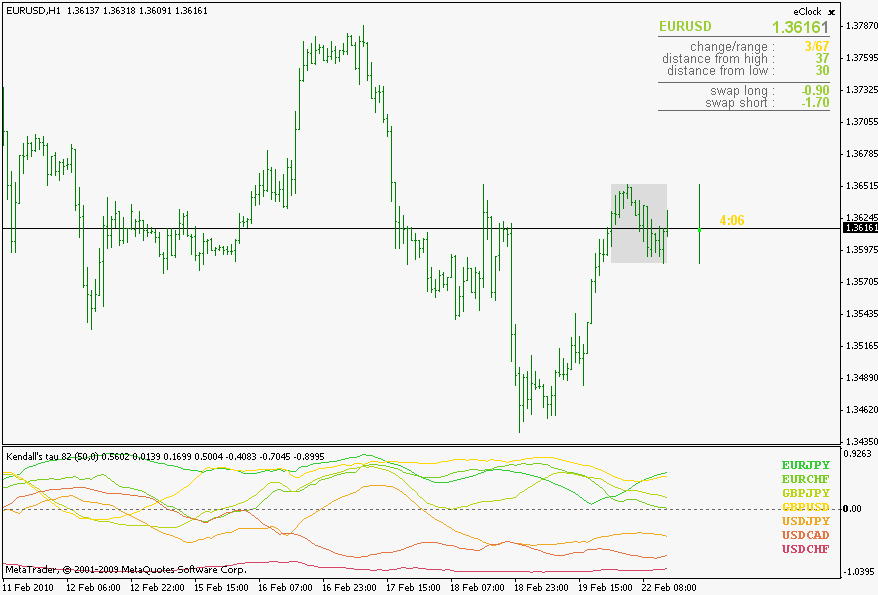
Examples :SubType 0 :
SubType 1 :
SubType 2 :
SubType 3 :
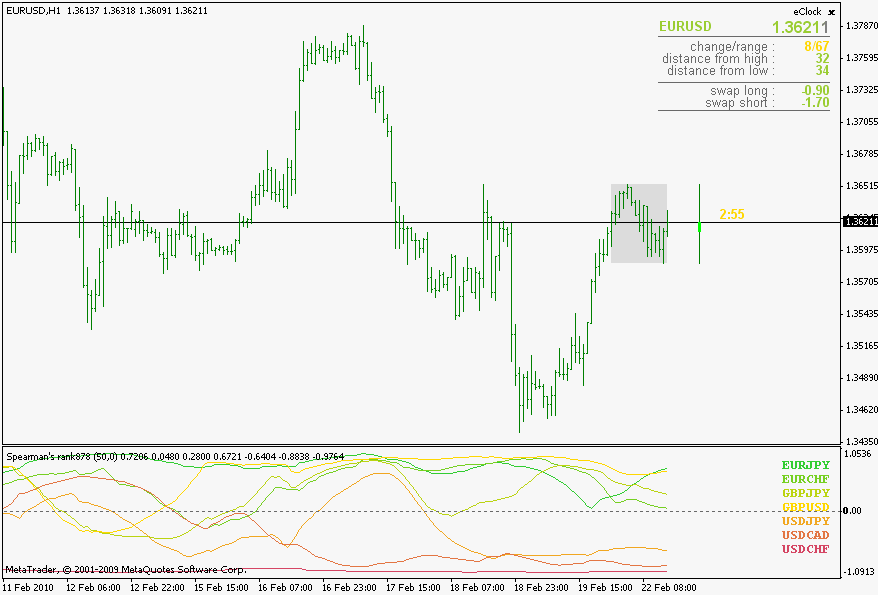
Spearman's rank correlation
Spearman's rank correlation (without the special case of Spearman's - this is a strict two arrays of values correlation) Some additional info about it can be found here : Spearman's rank correlation coefficient - Wikipedia, the free encyclopedia
Examples :
SubType 0:
SubType 1:
SubType 2:
SubType 3:
SubType 4:
A short explanation ...
A short explanation of correlations :Correlation value 1 would be an ideal correlation (it would mean that two symbols are having exactly the same changes at exactly the same time - by default only the symbol correlated to itself yields 1 all the time)_________________________Correlation value 0 would mean that there is no correlation (changes of the 2 symbols are random compared to each other)
Correlation value -1 would mean an ideal counter correlation (exactly the opposite changes in exactly the same time) More or less there is no ideal symbol pair for this, but some pars do tend to go in opposite directions (EURUSD - USDCHF for example as a typical counter correlation)
Also, if you compare the 3 Types of correlations, you will notice that they, roughly, yield same values and are showing same "conclusions" even though their mathematical models are different. So, it would mean that correlations can be and are quantifiable (these are the proofs of it  ) and by just a simple look at a fairly "non short" length correlation (I used 50 as an example) shows that the randomness in market is not that often.
They do not show the trends (you can not foresee the trend by looking at these) but there is an interesting "thing" happening from time to time : pay attention when a lot of symbols are gathering around 0 value - it is almost a sure sign that a breakout is around the corner
And a temporary conclusion ...
I was curios as of what exactly correlations are. Not the "fancy word using" "systems" tht are promissing trading systems from correlations, but the strictly mathematically modeled correlations.
From the results I am not disappointed since it is obvious that changes are not random as some would like to make us believe and usage (in manual trading) is obvious (finding divergences in a "correlated" or "opposite-direction-correlated" is straight forward) and also the "random zone pre-breakout games" are quite interesting (like watching the poker players trying to hide their intentions but knowing the "tell"  )
)
_________________________________
Now, what is left to do, is to find an "mechanical" aspect that can be used as a sort of signal. One of the ongoing projects ...
There are some great correlation startegies in Murray Ruggerio's Cybernetic Trading Strategies book.He refines intermarket analysis with spectral analysis(MESA) and correlation analysis.İnvestigating the correlation between currency pairs and US Treasury Market or German Bunds might have strong predictive value(cointegration).Definitly worth investigating it  .
.
Good work mladen.
I think that it is one of the most valuable indi a forex trader can find.
Does it exist under the form of a meter or a kind of bar set (like cja signal bars), just not to overcrowd the subwindows.
thanks
- Free trading apps
- Over 8,000 signals for copying
- Economic news for exploring financial markets
You agree to website policy and terms of use


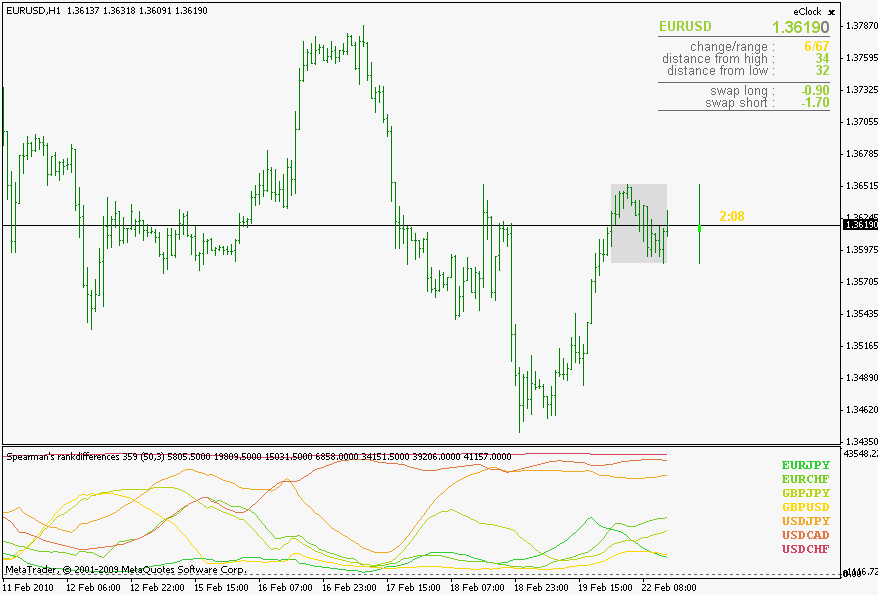
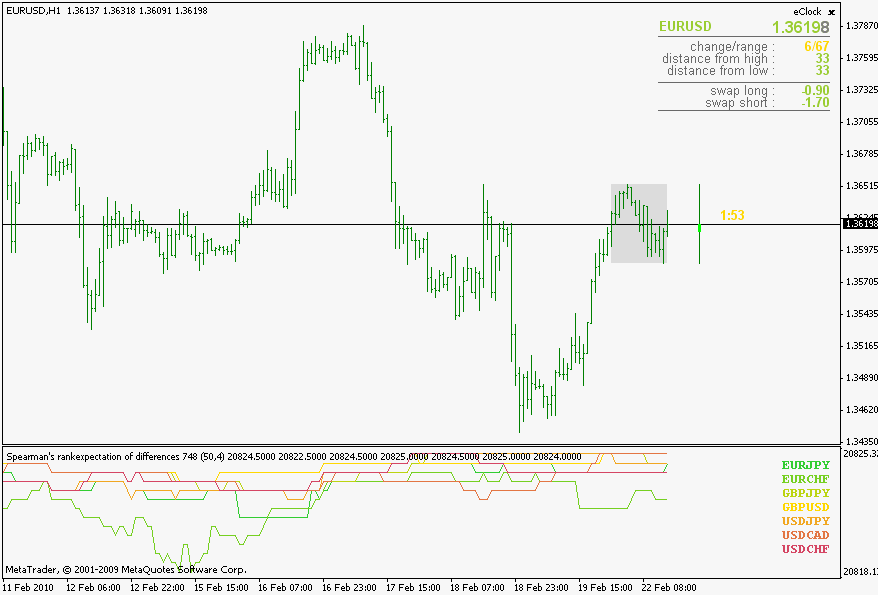
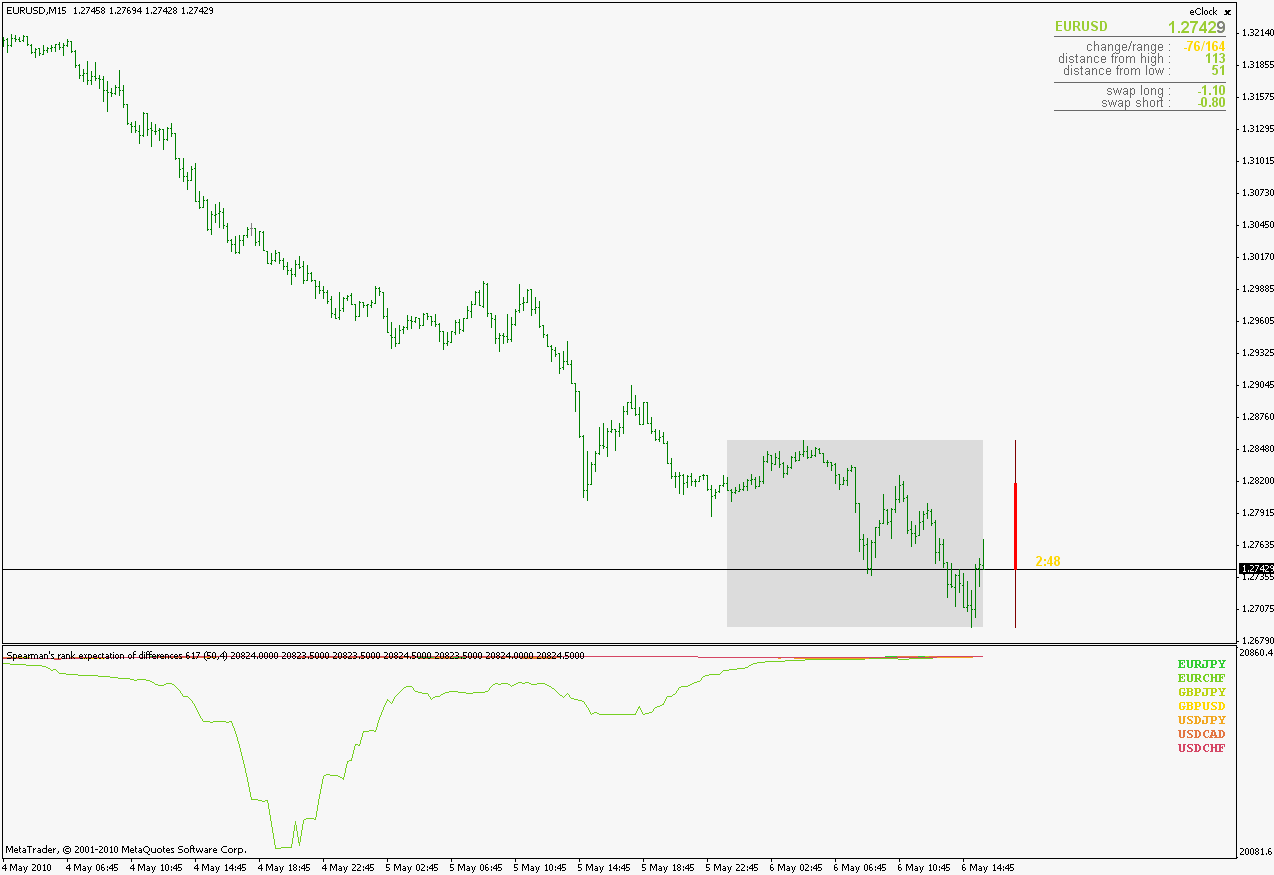
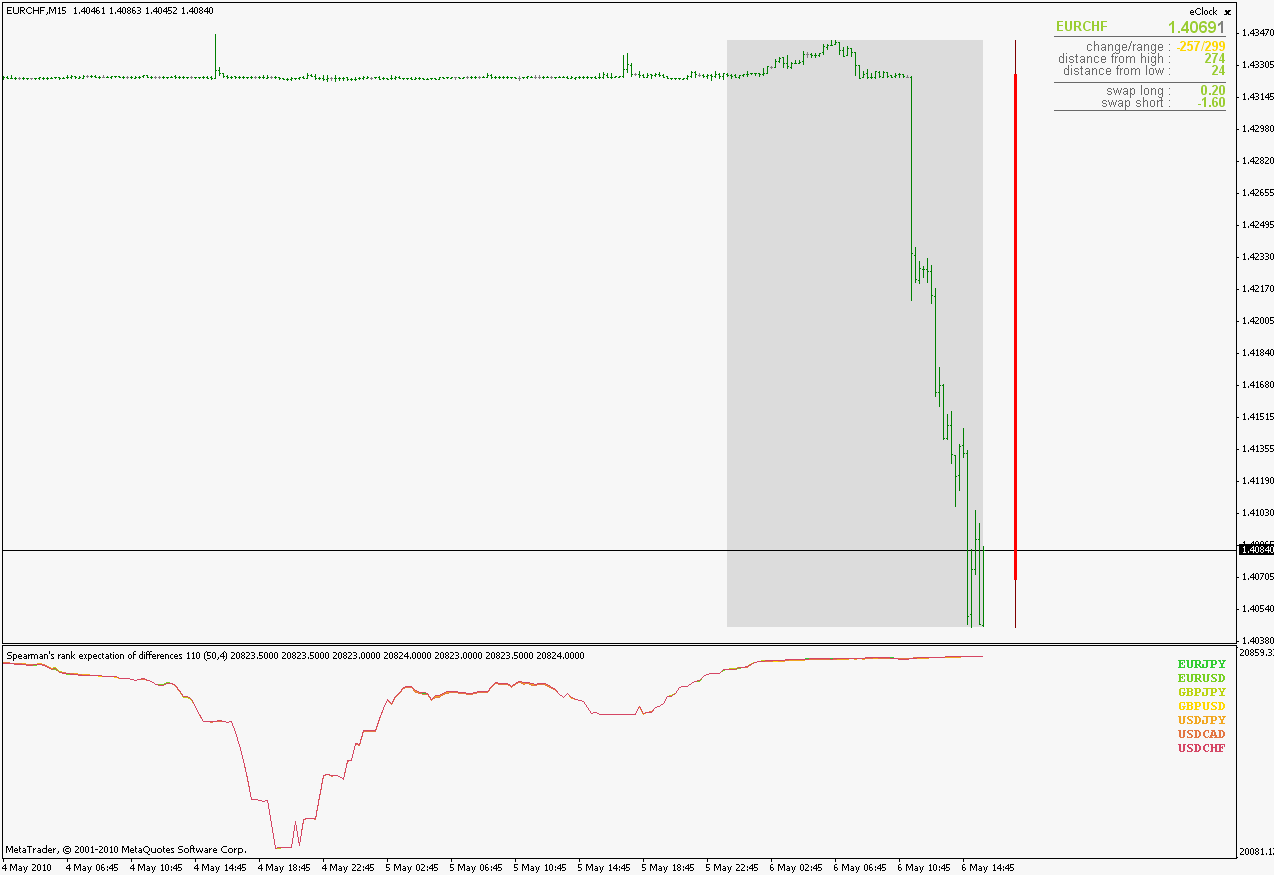
Quite some time ago I was doing some work on Pearson correlation indicator. It was working OK and I thought that the "story", as far as coding is concerned, is finished. There is Pearson, there is Spearman's rank correlations...
Ops, lets go back a bit :
Reading about correlations it struck me that Pearson correlation and Spearman's rank correlation are constantly compared. First thought was : "Why in the hell are they comparing those when the have so little in common?". Oh well, As usual, first reaction was wrong. The problem needed to be solved and the "mystery" needs to be clarified. So here we go :
First a statement : Spearman's rank correlation that usually is used on metatrader platform is just one special case of Spearman's rank correlation, and due to its cause of being special, it can not even be called a correlation. It comes from a fact that it is a case when the "counter part" used for correlation is of a constant rank and is because of that removed from the equitation : when using time as a second array in "correlations" calculation, time always has a constant rank (since it always has unequal values (unequal by same value - the change in time) in ascending order) and because of that can be removed from calculation - so it is a "correlation" of price and its times
__________________________________
Now that is the conclusion