Forex Trend Following - 4 Steps
Step 1
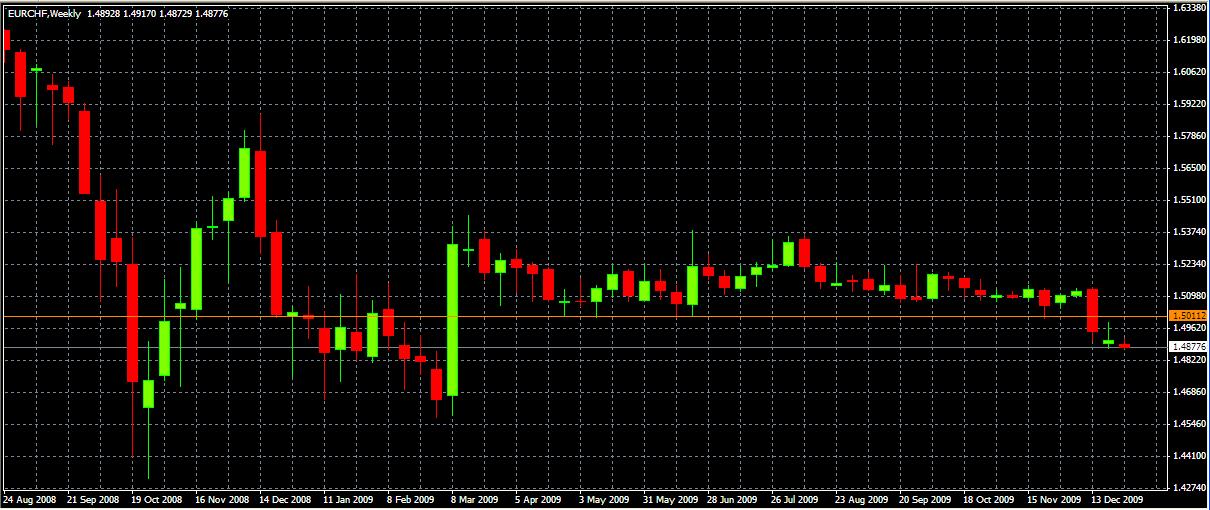
Step 1 - Weekly chart or Monthly chart.
Charts can be formed by using different time frames so that one gets a history of the price pattern over a reasonable period of time.
Traders can use these time frames to their advantage whether for day trading or swing trading.
Generally, the time frames used are intra-day, daily, weekly, monthly, quarterly or yearly.
A daily chart is made up of the intraday price range that has been com-pressed to show each day as a single period.
A weekly chart is made up of daily price ranges that have been compressed to show each week as a single period.
Traders usually concentrate on charts of daily and intraday data to forecast short term price movements.
While long on detail, short term charts can be volatile and contain a lot of noise.
Large and sudden price movements, wide high-low ranges and price gaps lead to volatility and can distort the overall prediction.
Weekly or monthly charts gives you the big picture look for levels of support that have been tested at least twice (the more the better) and
are in two time frames (the wider apart the better), these are levels that are deemed important by the market.
Step 2
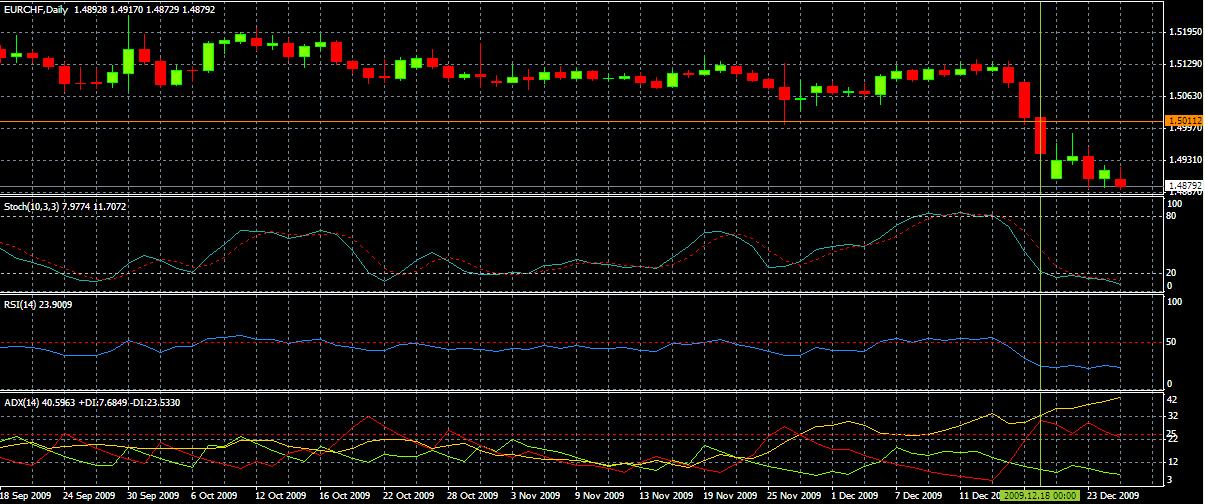
Look For the same levels on the daily chart and wait.
You are going to time your trading signal off daily chart, so look levels that are the same or close to the weekly levels
Now wait, wait, wait, ....
Wait for what ?
Wait for the price to break.
Step 3
Valid break ?
Not all breakouts continue, some are false - 43 % -, so wait for the break and check momentum.
You need to jump on a strong break.
I will not discuss momentum oscillators here - but you should use one or two to confirm the break. ADX,Stochastic and Relative Strength Index (RSI) are good ones to use.
If there in line with the break - go with it.
Step 4
Protection and follow the trend
Where do you put your stop-loss ?
Well I put behind the breakout point.
Now when the break occurs, if it is a good one it will accelerate .... So enjoy.
Advice 1:
DO NOT trail your stop up to quickly.
Way ?:
You want the move underway and you need to ignore volatility in the short term.
Once the move is well underway, start to trail your stop but hold it outside of daily volatility
this means trailing right back - when the move turns, you are going to give back some profit, that's ok.
If you caught just 60% of every major trending move you would VERY OK!
If it's a big move you will have plenty in the bank and you can't predict where prices go so don't try.
Example
I give you one example with EurChf from this month.
right now we have u/cad in waiting mode.
Good luck 
:)
Great!...wait 2 weeks more...you will get a margin call...
???
Can you explain how I get a margin call with a trade that are > 0 ?
Do you real follow this trade .... ?

My entry is 1.03835.
Follow some trades on twitter....
Hi,
I can understand that trend following is not always easy.
One friend post some trades on twitter : metatraderea (fxrace) on Twitter
Maybe better for you.
- Free trading apps
- Over 8,000 signals for copying
- Economic news for exploring financial markets
You agree to website policy and terms of use
If you want to make money from global FX, then the best profit potential comes from long term forex trend following and this means catching and holding the mega trends that last for weeks, months or years. You will see them on a forex chart but what the best way to catch them? Let's find out...
Were going to use a simple 4 step system, if you want to make forex profits it's worked and has always worked. This forex trading strategy will put the odds on your side and will ensure you catch EVERY BIG moves.
This system is simple and you need to understand this fact - all the best systems are. Forget expert trading systems, neural networks or lots if indicators - simple systems work best as they are robust and with fewer elements to break in the face of brutal ever changing market conditions.
Let's start with a simple fact:
If you want to make money forget "buying low and selling high" - you will miss all the big moves. Instead look to "buy high and sell higher" and for this you need to understand breakouts. Breakouts are simply breaks of important support or resistance levels on a forex chart. Most traders can't buy these breaks.
They want to hold on and wait for the price to come back to get in at a lower "better" price and of course prices don't pull back - they continue. The losing trader then watches these moves sail over the horizon and he's not in!
Make sure you don't make the same mistake. Right lets look how to catch and make forex profits from breakouts.
Next post will be step 1. Hopes it is ok ?