Mike Wolf Method
BrainTrend dots above or below are a confirmation of the trend direction.
DO NOT open a trade if BrainTrend's dots are on both sides of the trend, DO NOT open a trade if BrainTrend's dots are on an opposite side of the trend (i.e. below the price if we want to sell)
If BrainTrend dots move from one side to another - consider closing an open position.
To open a trade, you want BrainTrend's circle and an arrow be on the same side, and on the following candles you want BrainTrend's dots to be on the same side. (on top of the price if we are selling, below if buying).
Thank s a lot! Very intereresting!
milking mother wolf method -- the forex game

Thanks for the system, looks good on history 15 minutes. Why stochastic in template?
I see now 240 too. Sorry.
How to edit my last post?
Thanks for the system, looks good on history 15 minutes. Why stochastic in template?
I use it as an additional confirmation, just if I wanna be sure.
I see now 240 too. Sorry.
I guess that was a mistake in my first post, I use the very template I posted.
G'day spielbergsp,
Was just having a look at your system. I am now able to recognize when a correct signal comes up. However there has been another kind that i have noticed and decided to ask you about it.
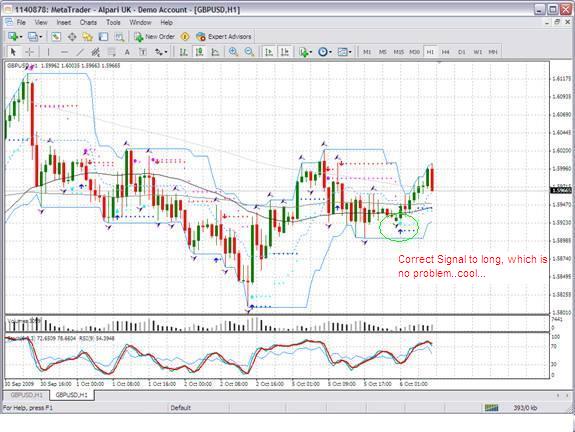
Image 1:
Shows us a typical entry signal for a long, which if i check back to your notes confirms it 
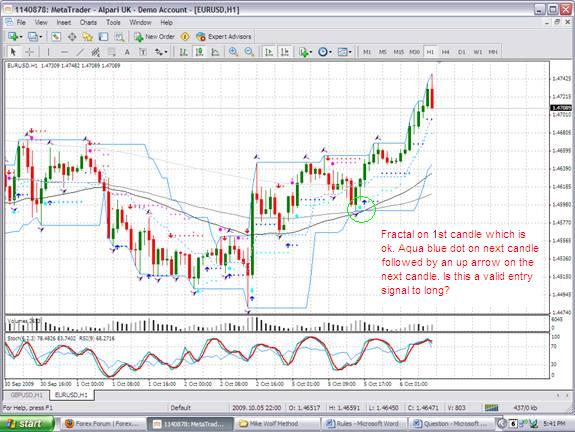
Image 2:
Shows us something slightly different. We get a fractal on the 1st candle, a dot on the next followed by an up arrow on the next...Does this constitute a valid entry signal or not? I ask this because the market moved up almost 100+ pips in that move which was just today by the way.. 
Thanks for the clarification..
Fxrulez
- Free trading apps
- Over 8,000 signals for copying
- Economic news for exploring financial markets
You agree to website policy and terms of use
So here's a strategy I developed over a period of time that seems to suit me well. Graph might seem too cluttered but you just gotta know what to look for.
Indicators used:
Price Channel (period 12)
Fractals
A few indicators from BrainTrend system (BrainTrend1Sig, BrainTrend1Sig, BrainTrend1Stop, BrainTrend1Stop)
3 WMAs (240, 120, 60)
Stochastic (6, 2, 3)
Timeframe: H1
Pairs: Any, depends on volatility, I prefer EURUSD, GPBUSD, USDCHF and a few others.
Entering:
To enter the market I want:
Price to bounce off Price Channel's level
Fractal to place a symbol on the same spot
BrainTrend indicators to place its circle and an arrow on the next or the second candle
And 120 and 240 EMAs should be following the trend we are entering. (i.e. going down if we want to sell)
Here's how a good signal looks like (marked with a green circle):
Exiting: I use a trailing stop, use common sense and volatility to figure out how far to place it. When the price goes well into no-loss zone I can increase the distance of a trailing stop to absorb any insignificant corrections.
Average trade length is anywhere from 2-3 hours to a day and a total of several succesful trades a week. I don't really remember when the system was signalling me one thing and the price went the other way. There were situations where I saw what I wanted to see, i.e. opened a trade when there was no strong signal. Overall, if you're not emotional when trading and patient, this works really nice.
Any suggestions are gladly appreciated. And if anyone wants to make an EA on this, I'd love to see that happen, I'm not really an expert when it comes to expert writing.
Template file is in the next post.
Cheers.