NZDCAD (Interesting pair for scalping)

Not being able to maintain a bid-tone approaching .7400 - NZD is weakening again. Important support is formed by the .7200 handle but I wouldn't bet too much on how strong it will be in case of a re-test. It is worth watching it, though, as a break down may provide a good selling point - objectives into the .6900-.7000 zone.[dailyfx]
USD/CAD's strong rebound form 1.0448 and the subsequent break of 1.0730 resistance reaffirm the bullish case rise from 1.0205 is still in progress. At this point, intraday bias is on the upside for 1.0851 resistance first. Break will confirm rally resumption from 1.0205 and should target 1.1101 resistance next. On the downside, below 1.0638 minor support will turn intraday bias neutral first.[actionforex]
"P&F NZDCAD1440 Box Size 75X5 or(5.13%) HI/LO
Data 0.8481 - 0.6145 ~ 29 Month ~ 891 Day
Database 634 records 0.75265 (Last Close)
2007-06-20 00~00
2009-11-27 00~00 (GMT+01:00) Paris
BJF Trading Group chart"
0.8475|~75|||x___________________________________|0.07%|37.92%
0.8400|~15O||x_o_________________________________|0.96%|36.7%
0.8325|~225||x_o_________________________________|1.84%|35.48%
0.8250|~3OO||x_o_________________________________|2.72%|34.26%
0.8175|~375||__o_____x___________________________|3.61%|33.03%
0.8100|~45O||__o_____x_o_________________________|4.49%|31.81%
0.8025|~525||__o_____x_o_________________________|5.38%|30.59%
0.7950|~6OO||__o_____x_o_____________________x___|6.26%|29.37%
0.7875|~675||__o_____x_o_____________________x_o_|7.15%|28.15%
0.7800|~75O||__o_____x_o_____________________x_o_|8.03%|26.93%
0.7725|~825||__o_____x_o_____________________x_o_|8.91%|25.71%
0.7650|~9OO||__o_____x_o_____________________x_o_|9.8%|24.49%
0.7575|~975||__o_x___x_o_____________________x_o_|10.68%|23.27%
0.7500|~1O5O|__o_x_o_x_o_x_______________x___x_o_|11.57%|22.05%
0.7425|~1125|__o_x_o_x_o_x_o_____________x_o_x___|12.45%|20.83%
0.7350|~12OO|__o_x_o_x_o_x_o_x___________x_o_x___|13.34%|19.61%
0.7275|~1275|__o_x_o_x_o_x_o_x_o_____x___x_o_x___|14.22%|18.39%
0.7200|~135O|__o___o_x_o_x_o_x_o_x___x_o_x_o_x___|15.1%|17.17%
0.7125|~1425|______o___o_x_o_x_o_x_o_x_o_x_o_x___|15.99%|15.95%
0.7050|~15OO|__________o_x_o_x_o_x_o_x_o_x_o_____|16.87%|14.73%
0.6975|~1575|__________o_x_o___o_x_o_x_o_x_______|17.76%|13.51%
0.6900|~165O|__________o_x_____o_x_o_x_o_x_______|18.64%|12.29%
0.6825|~1725|__________o_x_____o_x_o_x_o_x_______|19.53%|11.07%
0.6750|~18OO|__________o_x_____o_x_o_x_o_________|20.41%|9.85%
0.6675|~1875|__________o_x_____o_x_o_x___________|21.29%|8.62%
0.6600|~195O|__________o_x_____o___o_x___________|22.18%|7.4%
0.6525|~2O25|__________o_x_________o_x___________|23.06%|6.18%
0.6450|~21OO|__________o___________o_x___________|23.95%|4.96%
0.6375|~2175|______________________o_x___________|24.83%|3.74%
0.6300|~225O|______________________o_x___________|25.72%|2.52%
0.6225|~2325|______________________o_x___________|26.6%|1.3%
0.6150|~24OO|______________________o_____________|27.48%|0.08%
0.6075|~2475|____________________________________|28.37%|-1.14%
Column|~255O|4_175_6_1423147_5_108_14157_106_126_|
Count
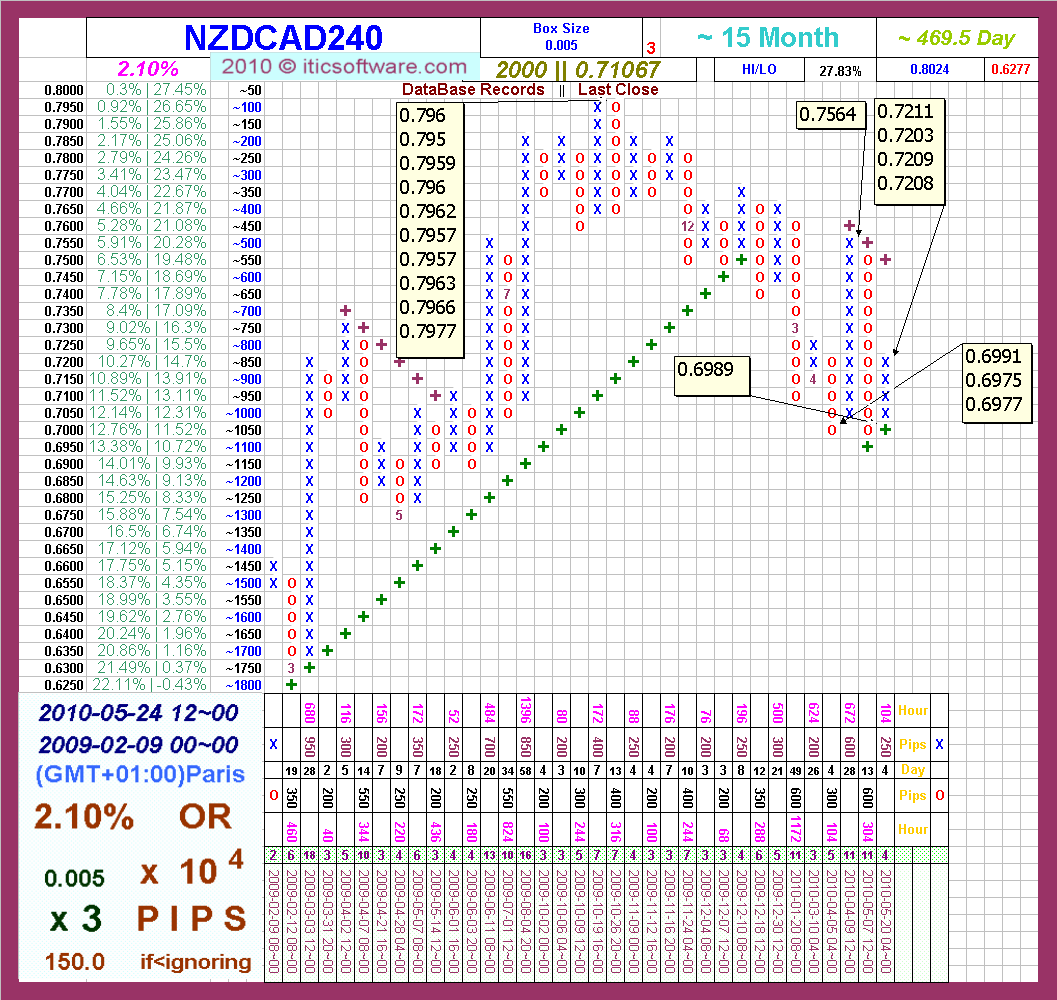
NZD\CAD review chart May 2010.
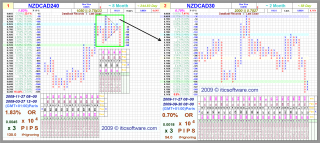
"P&F NZDCAD30 Box Size 25X3 or(1.03%) HI/LO
Data 0.7564 - 0.6975 ~ 2 Month ~ 60.04 Day
Database 2001 records 0.71065 (Last Close)
2010-03-25 13~00
2010-05-24 14~00 (GMT+01:00) Paris
BJF Trading Group; MDunleavy chart"
0.7575|~25|||______________+___________________|-0.15%|8.6%
0.7550|~5O|||______________x_+_________________|0.19%|8.24%
0.7525|~75|||__________x___x_o_+_______________|0.52%|7.89%
0.7500|~1OO||__________x_o_x_o___+_____________|0.85%|7.53%
0.7475|~125||__________x_o_x_o_____+___________|1.18%|7.17%
0.7450|~15O||__________x_o_x_o_______+_________|1.51%|6.81%
0.7425|~175||__________x_o___o_________+_______|1.84%|6.45%
0.7400|~2OO||__________x_____o___________+_____|2.17%|6.09%
0.7375|~225||__________x_____o_x___________+___|2.5%|5.73%
0.7350|~25O||__________x_____o_x_o___________+_|2.83%|5.38%
0.7325|~275||__________x_____o_x_o_____________|3.16%|5.02%
0.7300|~3OO||__________x_____o_x_o_____________|3.49%|4.66%
0.7275|~325||__________x_____o_x_o_____________|3.82%|4.3%
0.7250|~35O||o_________x_____o___o_____________|4.15%|3.94%
0.7225|~375||o_____x___x_________o_____________|4.48%|3.58%
0.7200|~4OO||o_x___x_o_x_______+_o_____x___x___|4.81%|3.23%
0.7175|~425||o_x_o_x_o_x_____+___o_____x_o_x_o_|5.14%|2.87%
0.7150|~45O||o_x_o_x_o_x___+_____o_x___x_o_x_o_|5.47%|2.51%
0.7125|~475||o_x_o_x_o_x_+_______o_x_o_x_o___o_|5.8%|2.15%
0.7100|~5OO||o_x_o___o_x_________o_x_o_x___+___|6.13%|1.79%
0.7075|~525||o_x_____o___________o_x_o___+_____|6.46%|1.43%
0.7050|~55O||o_x___+_____________o_x___+_______|6.8%|1.08%
0.7025|~575||o_x_+_______________o_x_+_________|7.13%|0.72%
0.7000|~6OO||o_+_________________o_+___________|7.46%|0.36%
0.6975|~625||+___________________+_____________|7.79%|0%
Column|~65O||1_8_4_5_6_1_4_5_1_5_1_6_3_5_3_3_3_|
Count||~675||1_________8_____2___5_____________|
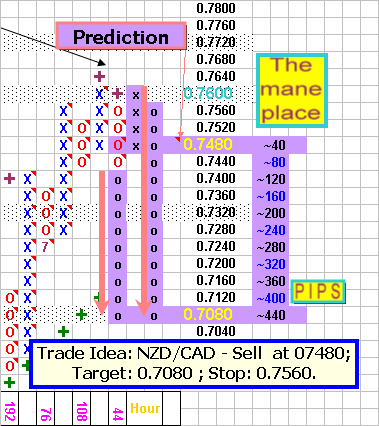
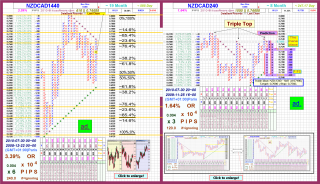
NzdCad formed a triple top.
Trade Idea: NZD / CAD - Sell at 0.7480; Target: 0.7080; Stop: 0.7560.
In the case of failures.
Trade Idea: NZD / CAD - Sell at 0.7600; Target: 0.7080; Stop: 0.7680.
"P&F NZDCAD15 Box Size 10X3 or(0.4%) HI/LO
Data 0.7603 - 0.7416 ~ 0 Month ~ 15.01 Day
Database 1050 records 0.74688 (Last Close)
2010-07-15 22~30
2010-07-30 22~45 (GMT+01:00) Paris
BJF Trading Group MDunleavy chart"
0.7600|~1O|||____________________________________x_+_________________________|0.04%|2.48%
0.7590|~2O|||____________________________________x_o_+_______________________|0.17%|2.35%
0.7580|~3O|||____________________________________x_o___+_____________________|0.3%|2.21%
0.7570|~4O|||________________________________x___x_o_x___+___________________|0.43%|2.08%
0.7560|~5O|||__o_________________________x___x_o_x_o_x_o_x_+_________________|0.57%|1.94%
0.7550|~6O|||__o_________________________x_o_x_o_x_o_x_o_x_o_+_______________|0.7%|1.81%
0.7540|~7O|||__o_____________________x___x_o_x_o_x_o___o_x_o___+_____________|0.83%|1.67%
0.7530|~8O|||__o_____________________x_o_x_o_x_o_____+_o_x_o_____+___________|0.96%|1.54%
0.7520|~9O|||__o_+___________________x_o_x_o_______+___o_x_o_______+_________|1.09%|1.4%
0.7510|~1OO||__o_x_+_________________x_o_________+_____o_x_o_x___x___+_______|1.22%|1.27%
0.7500|~11O||__o_x_o_+_______x_______x_________+_______o___o_x_o_x_o___+_____|1.35%|1.13%
0.7490|~12O||__o_x_o___+_____x_o_____x_______+_____________o_x_o_x_o_x___x___|1.49%|1%
0.7480|~13O||__o_x_o_x___+___x_o_x___x_____+_______________o___o___o_x_o_x_o_|1.62%|0.86%
0.7470|~14O||__o_x_o_x_o___+_x_o_x_o_x___+_________________________o_x_o_x_o_|1.75%|0.73%
0.7460|~15O||__o___o_x_o_x___x_o_x_o_x_+___________________________o_x_o_x_o_|1.88%|0.59%
0.7450|~16O||______o_x_o_x_o_x_o_x_o_+_____________________________o___o_x_o_|2.01%|0.46%
0.7440|~17O||______o_x_o_x_o_x_o_x_+___________________________________o_+___|2.14%|0.32%
0.7430|~18O||______o___o_x_o___o_+_____________________________________+_____|2.28%|0.19%
0.7420|~19O||__________o_______+_____________________________________________|2.41%|0.05%
0.7410|~2OO||________________________________________________________________|2.54%|-0.08%
Column|~21O||O_1_5_8_5_6_4_3_7_7_5_3_9_3_5_4_5_4_7_6_3_7_6_8_3_3_3_6_4_5_5_4_|
Count|~22O|||__1_____________________________________________________________|
- Free trading apps
- Over 8,000 signals for copying
- Economic news for exploring financial markets
You agree to website policy and terms of use
NZDCAD=(Canadian Dollar) X (New Zealand Dollar)
======================
The COT Index is the percentile of the difference between net speculative positioning and net commercial positioning measured over a specific number of weeks (either 52 or 13). A reading close to 0 suggests that a bottom is forming and a reading close to 100 suggests that a top is forming. The readings are for the actual currency, not the currency pair. For example, a reading of 100 on the Canadian Dollar suggests that the Canadian Dollar is close to a top (USDCAD close to a bottom).
Readings of 95 and higher as well as 5 and lower are in boldfaced red type to indicate potential market extremes. For example, an increasing index is bullish until the index is extreme (near 100), at which time the risk of a reversal or pause in the trend increases.(Large Speculators are Too Short US Dollars (COT) [dailyfx])
======================
"P&F NZDCAD240 Box Size 32X3 or(1.3%) HI/LO
Data 0.789 - 0.6863 ~ 4 Month ~ 119.17 Day
Database 512 records 0.78031 (Last Close)
2009-06-02 00~00
2009-09-29 04~00 (GMT+01:00) Paris
BJF Trading Group"
0.7904|~32|||________________________________________|-0.18%|15.17%
0.7872|~64|||____________________________________x___|0.23%|14.7%
0.7840|~96|||____________________________________x_o_|0.63%|14.24%
0.7808|~128||____________________________________x_o_|1.04%|13.77%
0.7776|~16O||____________________________________x_o_|1.44%|13.3%
0.7744|~192||____________________________________x___|1.85%|12.84%
0.7712|~224||____________________________________x___|2.26%|12.37%
0.7680|~256||____________________________________x___|2.66%|11.9%
0.7648|~288||____________________________________x___|3.07%|11.44%
0.7616|~32O||____________________________________x___|3.47%|10.97%
0.7584|~352||____________________________________x___|3.88%|10.51%
0.7552|~384||________________x___________________x___|4.28%|10.04%
0.7520|~416||________________x_o_____________x___x___|4.69%|9.57%
0.7488|~448||________________x_o_____________x_o_x___|5.1%|9.11%
0.7456|~48O||________________x_o_________x___x_o_x___|5.5%|8.64%
0.7424|~512||________________x_o_________x_o_x_o_____|5.91%|8.17%
0.7392|~544||________________x_o_x_______x_o_x_______|6.31%|7.71%
0.7360|~576||________________x_o_x_o_____x_o_x_______|6.72%|7.24%
0.7328|~6O8||________________x_o_x_o_____x_o_________|7.12%|6.78%
0.7296|~64O||________________x_o_x_o_____x___________|7.53%|6.31%
0.7264|~672||________________x_o___o_x___x___________|7.93%|5.84%
0.7232|~7O4||________________x_____o_x_o_x___________|8.34%|5.38%
0.7200|~736||____________x___x_____o_x_o_x___________|8.75%|4.91%
0.7168|~768||____________x_o_x_____o___o_x___________|9.15%|4.44%
0.7136|~8OO||____________x_o_x_________o_x___________|9.56%|3.98%
0.7104|~832||x___________x_o___________o_x___________|9.96%|3.51%
0.7072|~864||__o_________x_____________o_____________|10.37%|3.05%
0.7040|~896||__o_x___x___x___________________________|10.77%|2.58%
0.7008|~928||__o_x_o_x_o_x___________________________|11.18%|2.11%
0.6976|~96O||__o_x_o_x_o_x___________________________|11.58%|1.65%
0.6944|~992||__o___o___o_x___________________________|11.99%|1.18%
0.6912|~1O24|__________o_x___________________________|12.4%|0.71%
0.6880|~1O56|__________o_____________________________|12.8%|0.25%
0.6848|~1O88|________________________________________|13.21%|-0.22%
Column|~112O|1_5_3_3_3_5_103_149_4_7_3_6_124_6_3_143_|
Count