I need this simple indicator ......
Hi
I need this simple indicator but is difficult to explain:
Supposing that the price go up of 100pip , down of 50, up 100, down 30,up 200,ecc..
The indicator have on axis a value from +200 (pip) to -200 (central orizzontal line of zero) and indicate the values (+100 -50 +100 -30 +200, ecc..)
Is important that the indicator report only the max effective movement (like a trailing stop concept)
Example if the price go up of 100, down 30, up 10,down 30, up 100 the indicator must create +100 -50 + 100 (where -50= -30+10-30)
Exist this indicator?
Forgive my poor explanation, if you need I can create a graphical explanation.
thanksDear Newdigital .... if you move my message in this place ...no one will read it. 
Moved it back.
this is a trailing stop indicator;
It's good for choose a good trailing stop for your cross.
Someone is able to make this?
Interesting but by the explanation seems we're talking about RSI, calculation is close. Some graphics really would help.
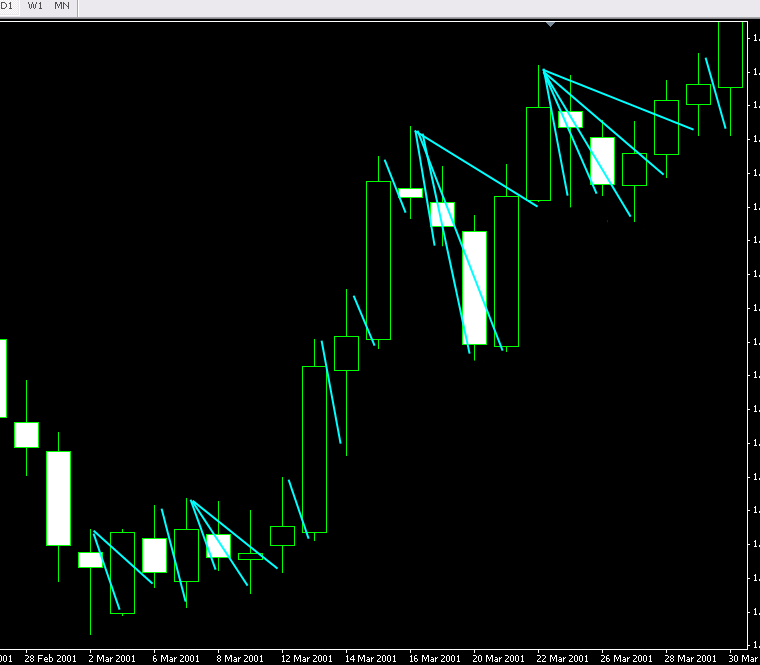
The indicator must trace distance (pips) from min and max during trends for
help to find the best trailing stop value.
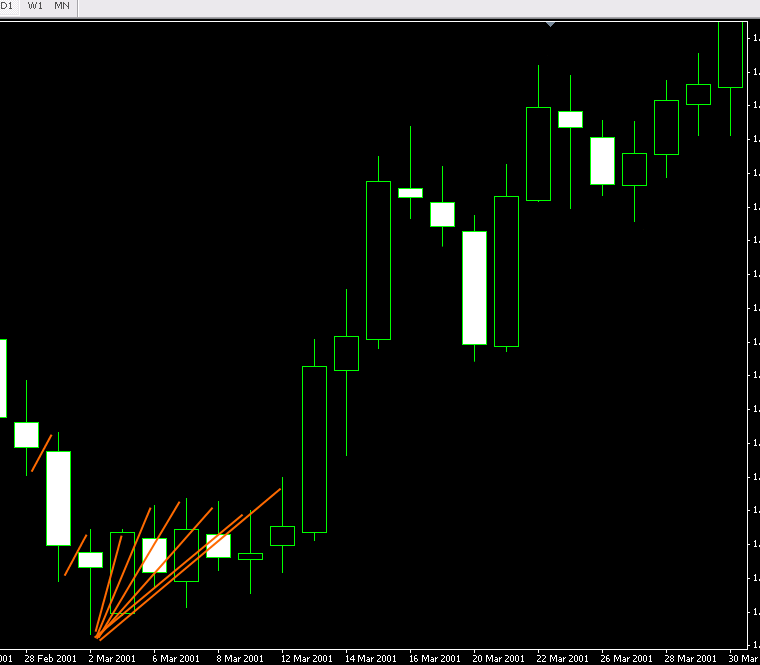
in the example you can see the calculation (orange) that indicator make
during trend. (Note the negative value if the price go down).
I hope this can help. Ask me other information if you want.
The indicator can be developed with one curve that go positive and negative or, another version
, can have two curves (long and short);
if close > previous close = -last close - previous
if close < previous close = last close - previous
is that?
no,
Indicator work only with min and max of each candle.
(in the example a1-a2-a5 are min and A-a3-a4 are max)
This indicator help to find the maximum retracing or maximum rally of displayed period and help to
enter a good trailing stop value.
I'm trying to make new graphic explanation.
thanks
Don't worry for a new graphic. If you post some kind of formula it would be better. An excel example would be great.
I try to explain the program for calculate 2 curves (Long and short case).
The indicator works only with displayed candles.
First curve calculate the distance in pips from max and min (retracing of price on long trend).
Second curve calculate the inverse case (short) ..but in this case a max value of pips must be set on indicator parameters.
Next I explain by excel or by a indications for the program.
ya sangat bagus sepertinya. cukup simple...
- Free trading apps
- Over 8,000 signals for copying
- Economic news for exploring financial markets
You agree to website policy and terms of use
Hi
I need this simple indicator but is difficult to explain:
I
t's necessary for choose a good trailing stop value of cross.
Supposing that the price go up of 100pip , down of 50, up 100, down 30,up 200,ecc..
The indicator have on axis a value from +200 (pip) to -200 (central orizzontal line of zero) and indicate the values (+100 -50 +100 -30 +200, ecc..)
Is important that the indicator report only the max effective movement (like a trailing stop concept)
Example if the price go up of 100, down 30, up 10,down 30, up 100 the indicator must create +100 -50 + 100 (where -50= -30+10-30)
Exist this indicator?
Forgive my poor explanation, if you need I can create a graphical explanation.
thanks