Larry Williams Greatest Indicators
Sunwest, can you show on the chart what you mean (signal interpretation)?
hi
Hello,
Attached is the indicator that Unca requested for Larry Williams Greatest Swing Value (GSV) Indicator:
"I would like to ask somebody to create indicator of Larry Williams. It's not actually indicator. Larry Williams introduces this as a concept in his book Long-Term Seecrets To Short-Term Trading. He calls it as a Greatest Swing Value (GSV). This value means distance between open and high (long side) or open and low (short side). He takes average of this value for few last days. But it is bit more complicated yet. For long side he counts only GSV for bars with down close (close lower than open) and for short side he count only bars with high close). That's all. We take as a buy or sell signal for example some percentage of GSV (180% by Larry W.). So that's it. If somebody would be able and willing to make this, I would really appreciate it"
Herer is the explanation of the Indicator:
- The green value is the average GSV in points for short Candle only (The top Bit of the short candle)
- The red value is the average GSV in points for long Candle only (The Bottom Bit of the Long candle)
This is just the 1st version but I believe as Unca suggested, the indicator could be made better and then could be programmed/built in an EA.
Here are the the following applications I have in mind  :
:
- Buy/Sell if value in points of the candle is over 1.8 times of the GSV (Unca/Larry Williams idea)
- 1.5 times GSV could be used as a good stop loss
- Could be used as level to confirm signal buy/sell (or take profit) for various time frames 1H/4H/1Day
Sunwestdid u use this system ? if yes could u please tell us your performance?
===================
Hello prasxz,
No I am starting this strategy to test it out as I just really liked the idea when I read it and it makes sense to use it as signal confirmation, stoploss and take profit level.
Hello fxbs,
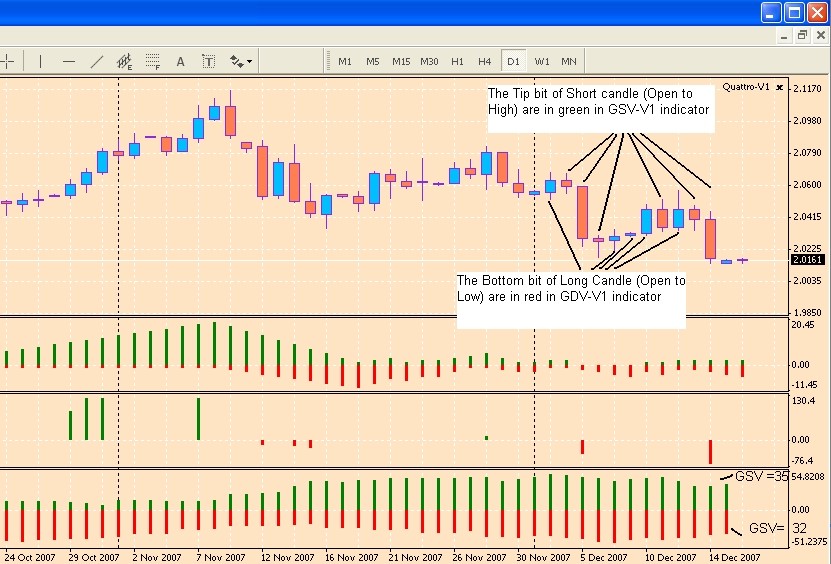
Attached is a screenshot GPB/USD Daily to visualise what it should look like.
In the Main Window you can see the Part of the candle that are taken into account to calculate the average GSV (Greatest Swing value).
The bottom indicator (GSV-V1) shows that:
- the average GSV (green) for short candle at present is 35
- the average GSV (red) for long candle at present is 32
Now what does it mean:
=> On average for a short candle the price will only go up by 35 pips from Open before changing direction and go/close down.
=> On average for a long candle the price will only go down by 32 pips from Open before changing direction and go/close up.
1) Signal example
So lets say the Open of todays candle is at 2.0170 and I want to buy or sell at 1.8 of GSV.
=> Short GSV= 35*1.8 = 63
=> Long GSV = 32 *1.8 = 58
I will now place a Buy at 2.0170+0.0058 = 2.0228
and a Sell at 2.0170-0.0063 = 2.0107
2) Stop Loss example
Lets say one of my signal ask me to buy or sell
==> If I buy at Open at 2.0170 I ll place my stoploss at 1.5 GSV = 32*1.5 =48 => 2.0170-0.0048=2.0122
==> If I Sell at Open at 2.0170 I ll place my stoploss at 1.5 GSV = 35*1.5 =53=> 2.0170+0.0053 = 2.0223
3) Take Profit example
Now lets say that you buy or sell at Open of a candle from any of your signal, you could set a first level of take profit at 0.75 of GSV to ensure that even if it swing back you took a bit chunk of it.
=> 2.0170 buy 1st take profit will be 0.75*32 = 24 pip = 2.0184
=> 2.0170 sell 1st take profit will be 0.75*32 = 26 pip = 2.0144
Now those examples are just suggestions for D1, but this could be also use 1H/4H and even W1.
This can be a system in itself of price action but it can also be combined with other simple signal to find TP, Stop loss etc...
My goal now is to enhance this indicator, maybe do a version on the main chart with Buy/Sell, TP and stop loss lines/level. Then we might integrate this into an EA to develop it further.
Sunwest
Refresh
IT's possible to modify this indicator so that it was refresh automatically with each new bar ?
Thanks
Hello,
Normally this indicator should refresh itself automatically, the actual bar or bar in progress is not displayed till the Close but you can decide to display it (be careful it might change as the current bar is being formed going up or down), in order to do so just:
==> change variable "vDoBarInProgress" to true in the indicator properties.
I ll carry on the work on this indicator when I come back from holidays the 14 of January
Bernard
Ok
Your version it's OK, my version this code more int counted_bars = IndicatorCounted();
Thanks, good vacancy
understanding Larry Wiliiams
In at least one of his books I have seen that you have to study carefully Larry's examples as he is not a science and math graduate, who is trained to be precise. For example he might say 1/4 bar but show examples that exhibit 1/3 bar. If you want your code to work as well as his technique does for him you must first really understand what he does.
I am just saying study well before you code. This applies to other traders' write-ups as well.
Big Be
Thank you
I just want to thank you Sunwest! I haven't had time so far to test it precisely, but it looks ok. I'd be happy if somebody else find this indicator usefull as well.
Larry Williams indicator Coder help please
Hi,
Please would you be so kind to write indicator according this rule ?
Measures Professional Buying vs. Public Buying
Developed by Larry Williams, this indicator would have two lines: The Public Buying (red line) at the beginning of the day and the Professional Buying (green line) at the end of the day.
This technique is to create two Advance/Decline lines.
* The Public Advance/Decline line is constructed by using the change from yesterday's closes to today's open.
* The professional Advance/decline line is constructed by using the change from today's open to today's close.
The lines are calculated by taking a moving average, normally 14-days, of the results.
This study is only for daily charts and can be used to highlight divergences between the Professional Advance/Decline (green line) and the price. The common interpretation of this study is if the Professional line (green) goes below the Public line (red) it is a sell signal and if the Professional line (green) goes above the Public line (red) it is a buy signal.
Pucio
- Free trading apps
- Over 8,000 signals for copying
- Economic news for exploring financial markets
You agree to website policy and terms of use
Hello,
Attached is the indicator that Unca requested for Larry Williams Greatest Swing Value (GSV) Indicator:
"I would like to ask somebody to create indicator of Larry Williams. It's not actually indicator. Larry Williams introduces this as a concept in his book Long-Term Seecrets To Short-Term Trading. He calls it as a Greatest Swing Value (GSV). This value means distance between open and high (long side) or open and low (short side). He takes average of this value for few last days. But it is bit more complicated yet. For long side he counts only GSV for bars with down close (close lower than open) and for short side he count only bars with high close). That's all. We take as a buy or sell signal for example some percentage of GSV (180% by Larry W.). So that's it. If somebody would be able and willing to make this, I would really appreciate it"
Herer is the explanation of the Indicator:
- The green value is the average GSV in points for short Candle only (The top Bit of the short candle)
- The red value is the average GSV in points for long Candle only (The Bottom Bit of the Long candle)
This is just the 1st version but I believe as Unca suggested, the indicator could be made better and then could be programmed/built in an EA.
Here are the the following applications I have in mind :
:
- Buy/Sell if value in points of the candle is over 1.8 times of the GSV (Unca/Larry Williams idea)
- 1.5 times GSV could be used as a good stop loss
- Could be used as level to confirm signal buy/sell (or take profit) for various time frames 1H/4H/1Day
Sunwest