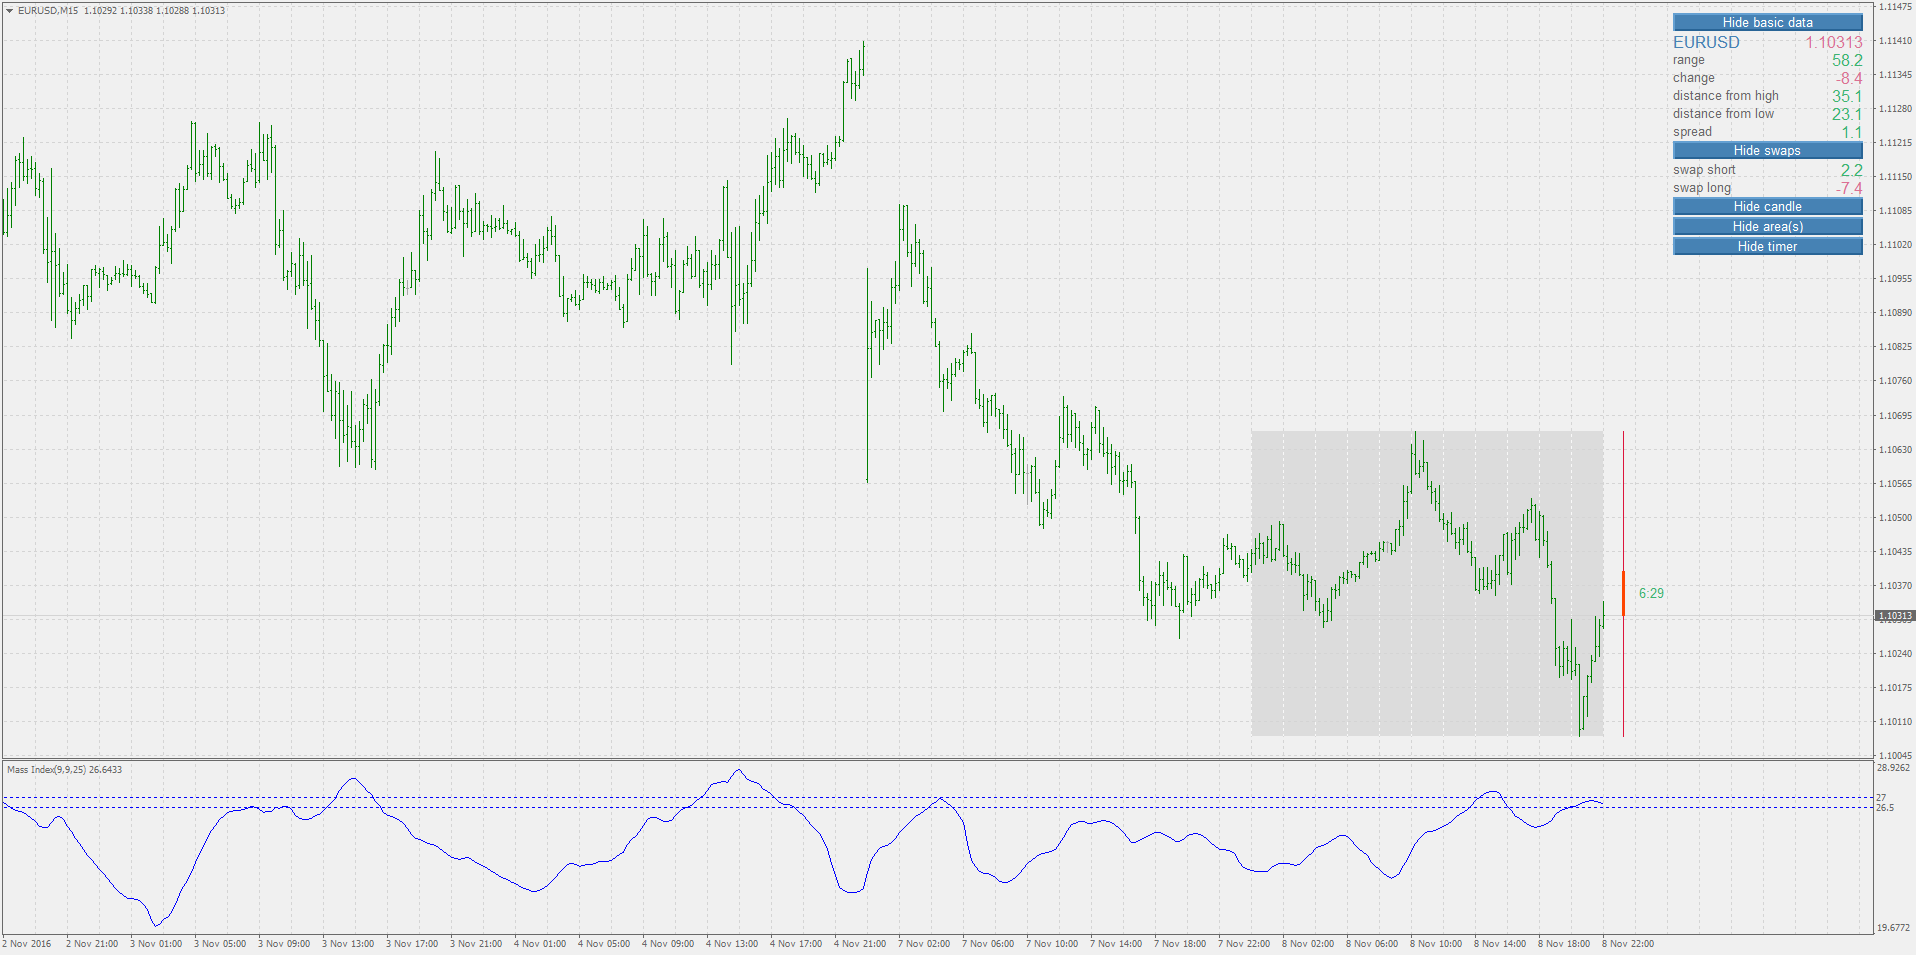
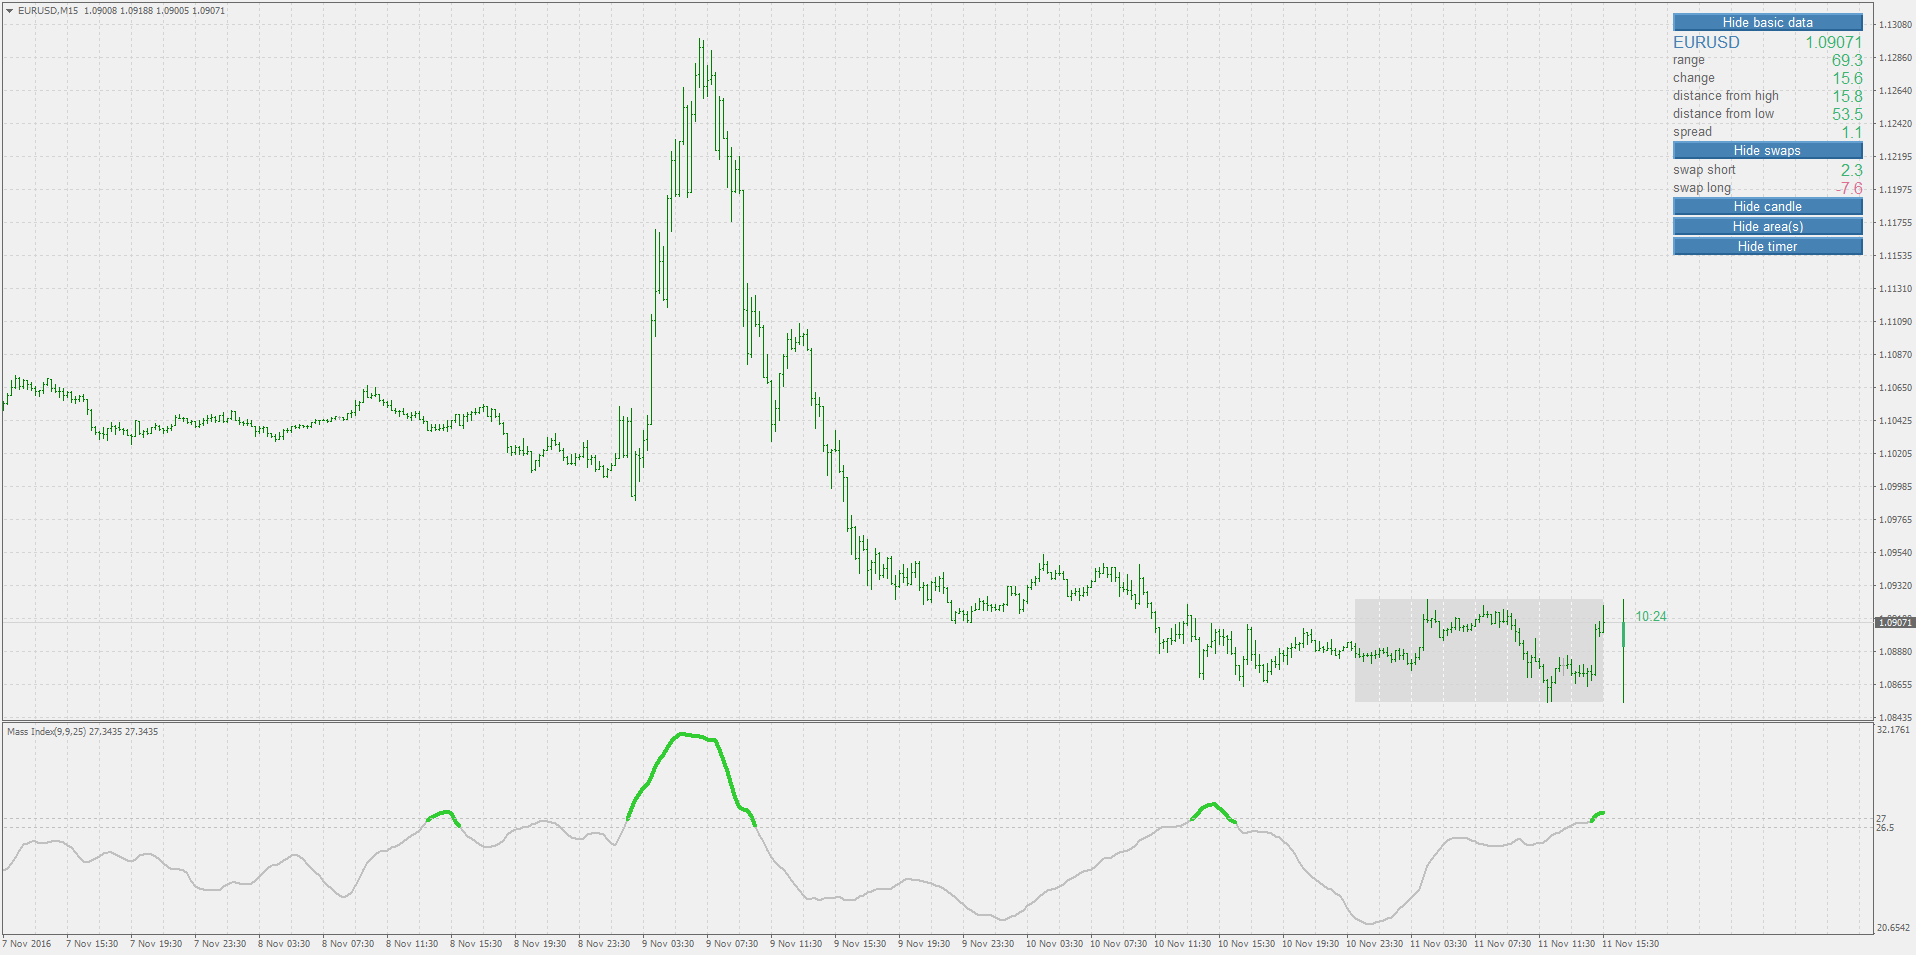
MASS index
I looked at Achelis "Technical Analysis from A to Z":
Overview
The Mass Index was designed to identify trend reversals
by measuring the narrowing and widening of the range
between the high and low prices. As this range widens,
the Mass Index increases; as the range narrows
the Mass Index decreases.
The Mass Index was developed by Donald Dorsey.
Interpretation
According to Mr. Dorsey, the most significant pattern
to watch for is a "reversal bulge." A reversal bulge
occurs when a 25-period Mass Index rises above 27.0
and subsequently falls below 26.5. A reversal in price
is then likely. The overall price trend
(i.e., trending or trading range) is unimportant.
A 9-period exponential moving average of prices is
often used to determine whether the reversal bulge
indicates a buy or sell signal. When the reversal
bulge occurs, you should buy if the moving average
is trending down (in anticipation of the reversal) and
sell if it is trending up.
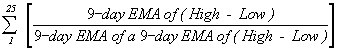
Calculation
To calculate the Mass Index:
Calculate a 9-day exponential moving average ("EMA")
of the difference between the high and low prices.
Calculate a 9-day exponential moving average
of the moving average calculated in Step 1.
Divide the moving average calculated in
Step 1 by the moving average calculated in Step 2.
Total the values in Step 3 for the number of
periods in the Mass Index (e.g., 25 days).Thanks Newdigital !
I find a code for DealBook.
Can sombody help me to translate in MT4 ??
-----------------------------------------------------------
indicator Mass_Index;
input period = 25;
draw line("Mass");
vars ahl(series), aahl(series), i(number), sum(number), en(number);
begin
ahl := ema(high - low, 9);
aahl := ema(ahl, 9);
sum := 0;
en := front(aahl) + period - 1;
if en <= back(aahl) then begin
for i := front(aahl) to en do
if aahl 0 then
sum := sum + ahl / aahl;
line[en] := sum;
for i := en + 1 to back(aahl) do begin
if aahl 0 then
sum := sum + ahl / aahl;
if aahl 0 then
sum := sum - ahl / aahl;
line := sum;
end;
end;
end.
---------------------------------------------------------------------------------------------------------
indicator Price_Oscillator;
input price = close, short_period = 1, long_period = 25, percent_mode = true;
draw line("Price Osc");
vars avg1(series), avg2(series);
begin
avg1 := sma(price, short_period);
avg2 := sma(price, long_period);
if percent_mode then
line := 100 * (avg1 - avg2) / avg2
else
line := avg1 - avg2;
end.
--------------------------------------------
Thanks...
The Mass Index was developed by Donald Dorsey to identify trend reversals by using the changes of daily price ranges to identify reversals in trends. As the price ranges narrow, the Mass Index decreases. As the price ranges widen, the Mass Index increases.
Mass Index
A significant pattern to watch for is the "reversal bulge." These occur when on a 25-period plot the Mass Index surpasses 27 then falls past 26.5.
A 9-period Exponential Moving Average of prices is often used to determine if the reversal bulge indicates a buying or selling. If a reversal bulge occurs, buy if the moving average is trending down (in anticipation of the reversal) and sell if it is trending up.
The Mass Index uses the range of the bars to calculate several values, including exponential averages of the ranges. It then calculates and plots an index of these calculations. The Mass Index is used in trending markets to monitor direction and warn of potential changes in forex market direction.
The Mass Index signals a possible price reversal when the Mass Index line crosses above the setup line and subsequently falls below the trigger line. This is known as a reversal bulge. The Mass Index does not identify the trend direction, but rather warns of possible reversals.
Upgraded mass index (it was about time :))
Can it be multi color (for level breaks)?
Can it be multi color (for level breaks)?
Here is a version that changes the color when it crosses the higher level, and reverts to no color when the break bellow the lower level happens (that should signal a possible price reversal, according to Donald Dorsey)
- Free trading apps
- Over 8,000 signals for copying
- Economic news for exploring financial markets
You agree to website policy and terms of use
Hello !
Where I can get this indicator ?
Mass Index.
Thanks in advance.
PipeTrader
Trade to live and Live to trade!