Indicators: Awesome Modified
Forum on trading, automated trading systems and testing trading strategies
iTC, 2014.04.21 08:41 AM.
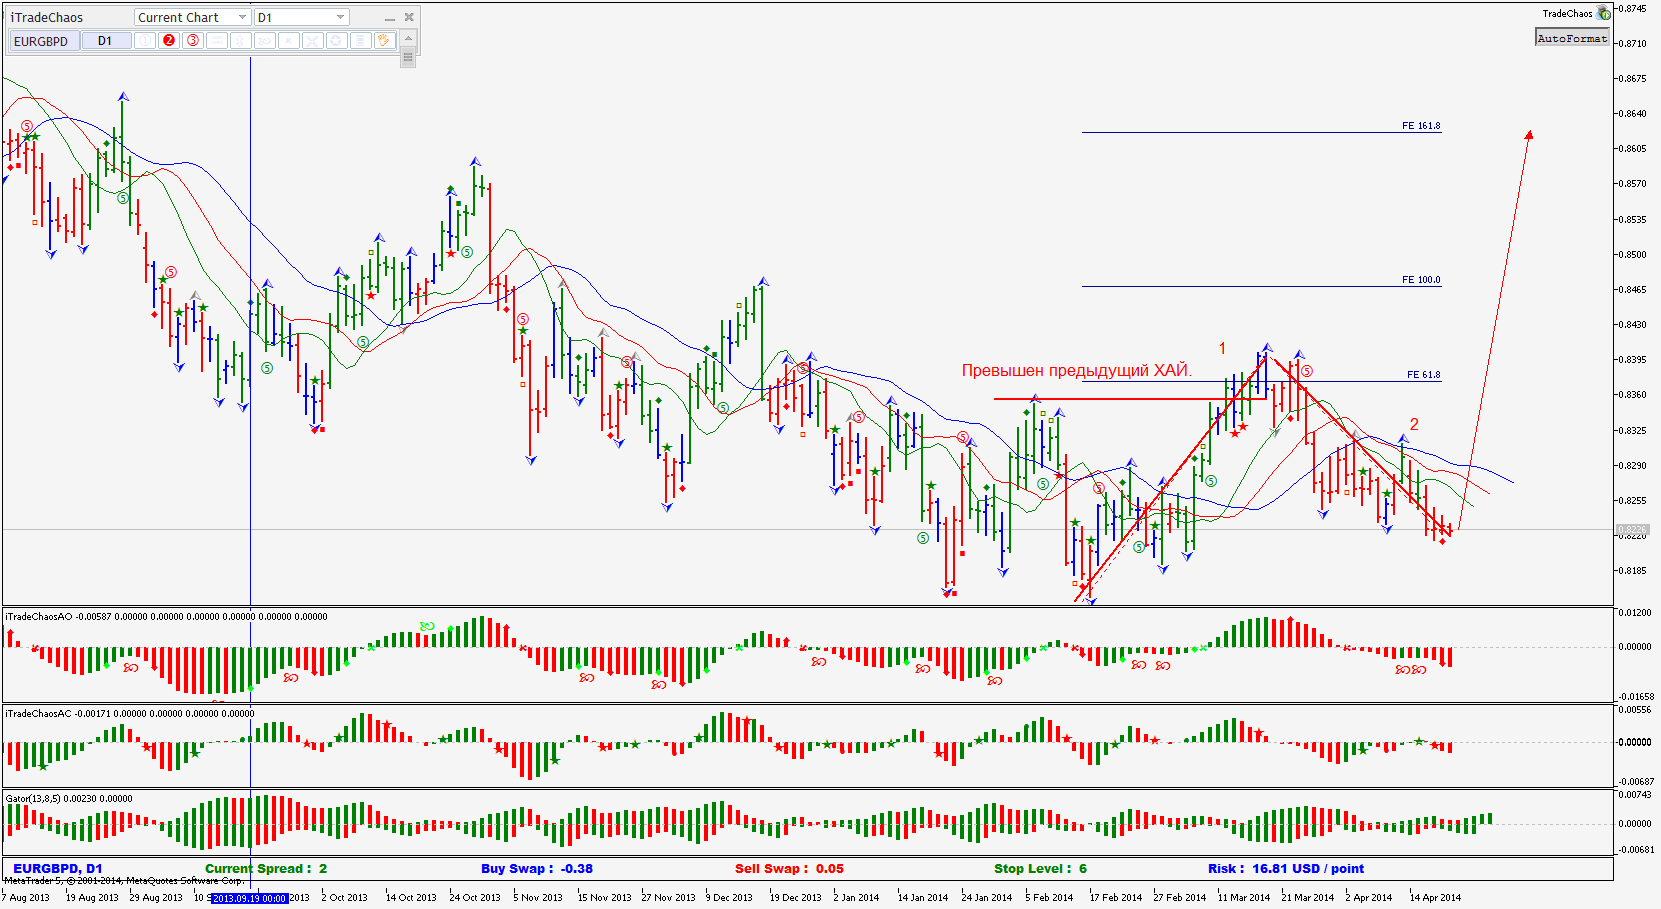
It is impossible without Williams. His Super AO is a real grail indicator. Counting waves is very simple. There are clear rules. They just need to be followed.
Three main applications of the indicator AO (Awesome Oscillator) when counting Elliott waves.
1. To determine the peak of the 3rd wave of any order on any time frame.
2. To determine if the minimum conditions for wave 4 are met (Histogram crossing the zero line after the peak of the third wave). 3.
3. To determine if there is a divergence between price and momentum, and to show what the market momentum is now.
Determining the peak of wave 3 using the AO.
Wave 3 will have the highest peak on the AO of 100-140 bars.
Forum on trading, automated trading systems and testing trading strategies
iTC, 2014.04.21 08:44
Finding the first wave is quite simple. Using the example of buying. We should see that the previous high on the left side of the chart is broken and AO is above zero. Then the AO changes colour to red in the second wave and then the colour change to green "BLUE" takes the market into the third wave.Forum on trading, automated trading systems and testing trading strategies
iTC, 2014.04.21 08:59 pm.
To avoid confusion with the first wave, I should add that you should look at the previous 140 bars. Was there a five wave cycle before that or not. If you can not see, then the sideways is ordinary and should not trade. So there is no first wave there.Forum on trading, automated trading systems and testing trading strategies
iTC, 2014.04.21 09:24 AM.
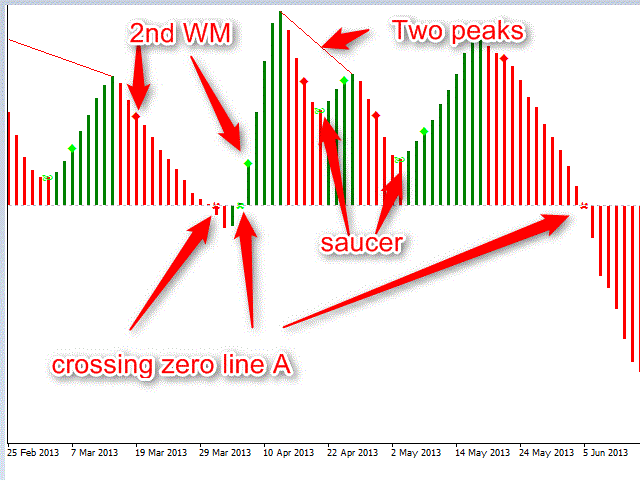
Here is an example of the first and second wave the other day. You can reverse the second wave into sub-waves of smaller TFs and look for upward momentum after reaching the target level. See Figure 2.

Forum on trading, automated trading systems and testing trading strategies
iTC, 2014.04.22 13:38
Having an ordinary AO indicator, even without seeing the chart you can know what to do buy or sell, let's look at the histogram of the indicator. Here is the markup.
- Free trading apps
- Over 8,000 signals for copying
- Economic news for exploring financial markets
You agree to website policy and terms of use
Awesome Modified:
This indicator is a modification of classical Awesome indicator.
It computes the smoothed rate of change of two exponential means. More precisely, the indicator has 5 inputs: shortmean, mediummean and longmean stand for three exponential averages (by default 18, 40 and 200, respectively). The last two inputs indicate the exponential average for the rate of change between the shortmean-mediummean and mediummean-longmean.
Author: Manel Sanchon