Separation Trader
would it be possible to have an EA?
Sounds wonderful, how would an EA work with this indicator? Is that a possiblity?
Tks
Berdj 
Separation Success
I tried your setup for the moving averages and translated it to other timeframes: H1 and Daily. Cannot find a good combination for the M1 chart. And I don't know about taking just twenty pips, but these crossing, bulging MA's are the best indicator I have found for predicting trends. It has lead to my first really successful day since starting to studying everything about forex on the computer a year ago. Twenty-four trades in 36 hours: two of them bad (down $110) total earnings: @ $2000. All single standard lots. This calls for a smiley. (but I can't figure out how to operate them.)
P.S. Didn't notice the indicator. Will have to try that too. B.
?
Sorry for sounding dim, to use the indicator to buy you wait until it is +8 and to sell -8?
I have almost identical system but for major 3 no jpy allowed and slightly diff rules, mine works well and based on that moving average, nobody wants to code it though.
Seperation
I post this because I experienced this indicator and AE have great possibilities.
I got the indicator from another forum, where it was placed free. Also the AE.
Now first about the indicator. It has to red lines: upper and lower. That is were the ma has a difference of +8 and -8. The ma are: 10 and 26.
The original approach is to buy when the green line passes the upper red line and to sell if the green line goes through the lower red line. That can be done, and will be profitable. But...
Looking at the trend, when up, it is also very profitable to buy when the green line passes up through the lower red line. And of course when the trend is down, sell from passing trough the upper red line downwards.
One can stay in that trade until the oscillator goes trough the red line at the bottem going upwarts again or take profit earlier of course.
Now the AE. The original one does not make much profit, because it waits to long entering the trade. So I changed a little bit, and instead of waiting, it enters the trade almost at the same point where the oscillator crosses the red line. And from that point the AE started to make - a lot - of money for me.
Now the bottomline of the text:
The AE must be rewritten a bit. It must enter a trade in the direction of the trend according to the above explained.
Someone interested?
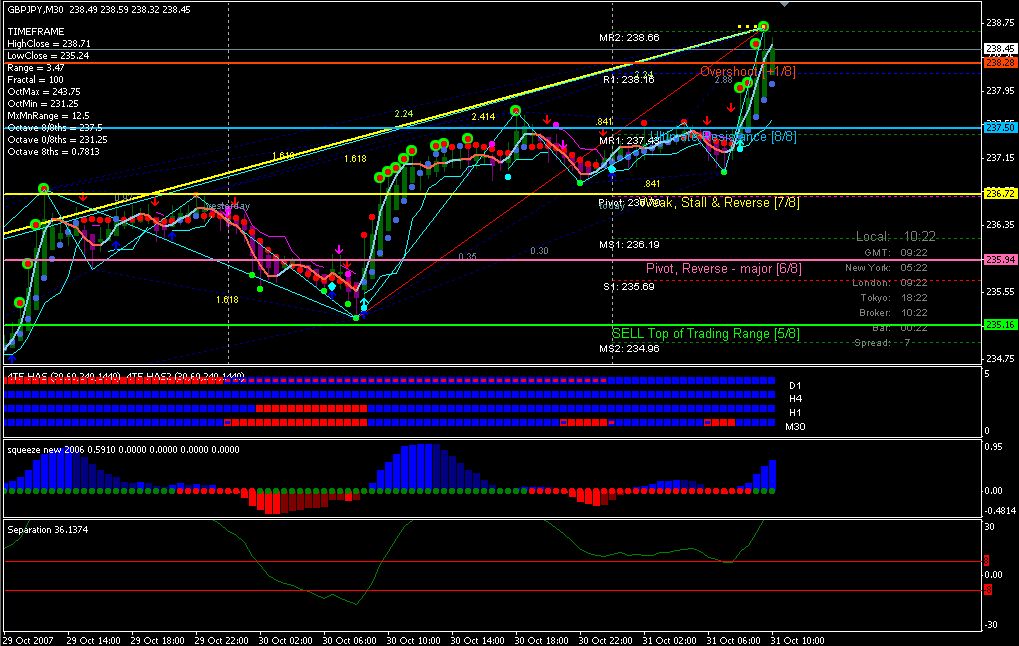
The attached picture show the indicator at the bottem. You can see when the line crosses from low to high the red line. And then it stays above the red line, showing that the trend is still up.
I tried your setup for the moving averages and translated it to other timeframes: H1 and Daily. Cannot find a good combination for the M1 chart. And I don't know about taking just twenty pips, but these crossing, bulging MA's are the best indicator I have found for predicting trends. It has lead to my first really successful day since starting to studying everything about forex on the computer a year ago. Twenty-four trades in 36 hours: two of them bad (down $110) total earnings: @ $2000. All single standard lots. This calls for a smiley. (but I can't figure out how to operate them.) P.S. Didn't notice the indicator. Will have to try that too. B.
Congratulations!!
Did you trade it on the 5m timeframe or did you use another timeframe?
I post this because I experienced this indicator and AE have great possibilities.
I got the indicator from another forum, where it was placed free. Also the AE.
Now first about the indicator. It has to red lines: upper and lower. That is were the ma has a difference of +8 and -8. The ma are: 10 and 26.
The original approach is to buy when the green line passes the upper red line and to sell if the green line goes through the lower red line. That can be done, and will be profitable. But...
Looking at the trend, when up, it is also very profitable to buy when the green line passes up through the lower red line. And of course when the trend is down, sell from passing trough the upper red line downwards.
One can stay in that trade until the oscillator goes trough the red line at the bottem going upwarts again or take profit earlier of course.
Now the AE. The original one does not make much profit, because it waits to long entering the trade. So I changed a little bit, and instead of waiting, it enters the trade almost at the same point where the oscillator crosses the red line. And from that point the AE started to make - a lot - of money for me.
Now the bottomline of the text:
The AE must be rewritten a bit. It must enter a trade in the direction of the trend according to the above explained.
Someone interested?
The attached picture show the indicator at the bottem. You can see when the line crosses from low to high the red line. And then it stays above the red line, showing that the trend is still up.What timeframe do you trade this on?
Do you trade other currencies besides EUR/USD?
Some timeframe rules would probably help as well. A big trader pulsing the market in the late afternoon (EST here) might produce enough of a run to spread the MA's and then die out.
I scrolled back on the GPY/JPY on the M1 with the posted indicator with +8 and -8 settings which seemed reasonable and simply traded (hypotheticaly by eye and the history was very limited) from one side to the other...this seems like a simple EA to code...why not? (no averaging in just entries with a touch)
What a simple system...could someone throw together an EA from the posted indicator so that we may forward test? A filter or two could be added later if needed.
ES
- Free trading apps
- Over 8,000 signals for copying
- Economic news for exploring financial markets
You agree to website policy and terms of use