Statistic approch
excellent
Very interesting - please do more
hmmm...
so the conclusion is..? sorry I don't get it.
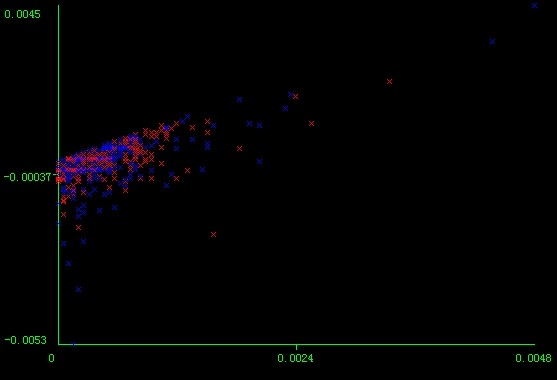
No conclusion can be told, except someone can successfully partition the red and blue with rules.
random walk theory??
No conclusion can be told, except someone can successfully partition the red and blue with rules.
No conclusion is a conclusion 
So before someone can find a rules or find something repeating on the picture, a random walk theory is proved, right?
Hi,
Perhaps the reason for the repitition is because the inputs all have one thing in common that is the same, namely the price, high, low, open etc...with them as the common basis for the calcualtion of MACD,CCI et al...it causes consistancy or a pattern whatever... this could be proved when comparing two different time frames but that opens up a different can of worms alltogether again then
Point is, that if the main ingredients of a mix stays consistant, the general visual outcomes would mostly appear to be the same also with very slight diffs.
Nice displays 
FX Sniper
Study done on H1 tf, with EURUSD.
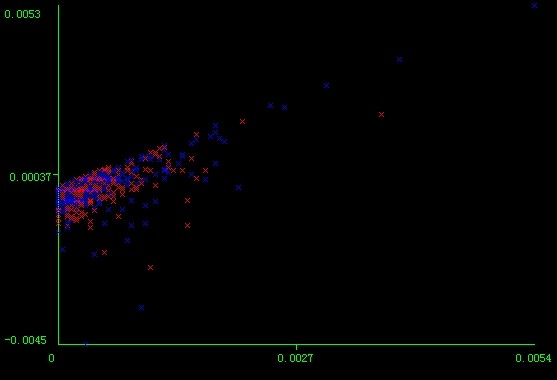
1)
- red sign, > 20 pips down movement
- X, standard deviation value (price low, current bar)
iStdDev(NULL,0,2,0,3,PRICE_LOW,0)
- Y, difference between two standard deviation values
iStdDev(NULL,0,2,0,3,PRICE_LOW,0)-iStdDev(NULL,0,2,0,3,PRICE_HIGH,0)
2)
- blue sign, > 20 pips up movement
- X, standard deviation value (price high, current bar):
iStdDev(NULL,0,2,0,3,PRICE_HIGH,0)
- Y, difference between two standard deviation values:
iStdDev(NULL,0,2,0,3,PRICE_HIGH,0)-iStdDev(NULL,0,2,0,3,PRICE_LOW,0)
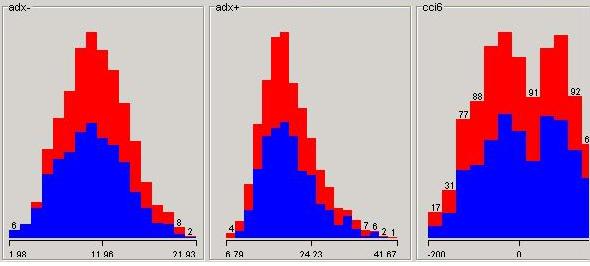
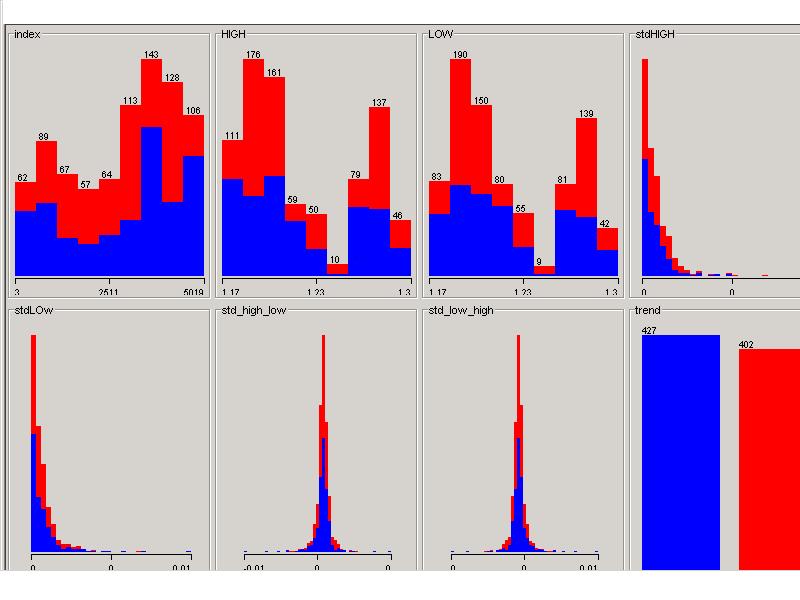
3)Totall statistics.
- Free trading apps
- Over 8,000 signals for copying
- Economic news for exploring financial markets
You agree to website policy and terms of use
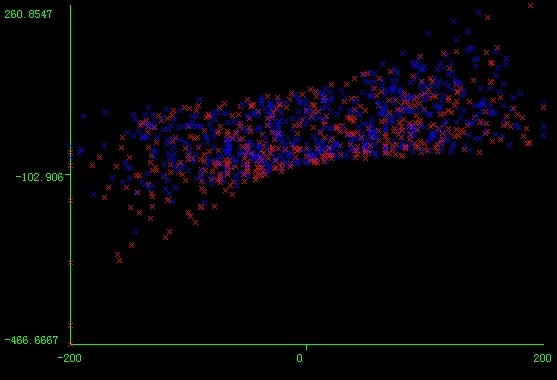
The title says what I'm doing. Here is a photo I produced. On the photo every red sign is a point followed with an at least 20 pip down movement. Every blue sign is a point followed with an at least 20 pips up movement.
The x value is MACD main value at 5 tf. The y value is difference between MACD main and siganl values.
There are abusolute no corralation.