At least 10-50 pips a day
Thanks for this, can you plesae explain how to use this indicator, when to enter the S/B position based on the indicator?
Thanks
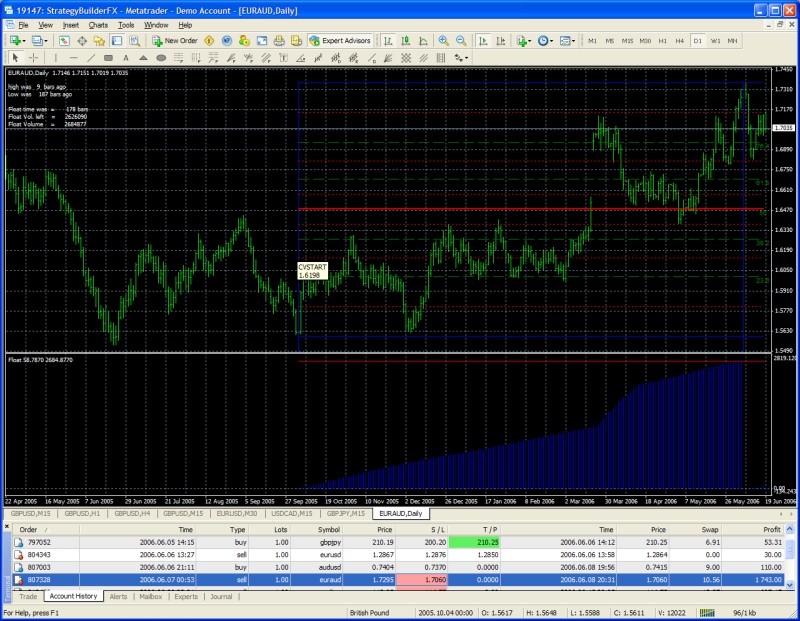
As u can see from the image I posted, I am using it with a 30M chart too. I am using Pivot levels too to make sure we are in a safe way. I am selective in my trades and not trade all the signals I have. Looking at daily chart can give me a good prediction if the market is up or down. If I see that the daily/4H or even 1H trend is down I will wait for the Float to show a sell signal.
I am using 13EMA/20SMA to find out the direction(it is working not bad at all)
I don't know which setup is better. I am using 100.
one question,
does the float indicator repaints the past?
one question, does the float indicator repaints the past?
As I said, sometimes yes. But if u will be selective and use other indicators to predict the direction, the float will be a very good entry point.
Guys these indicator paints the past , be carefully
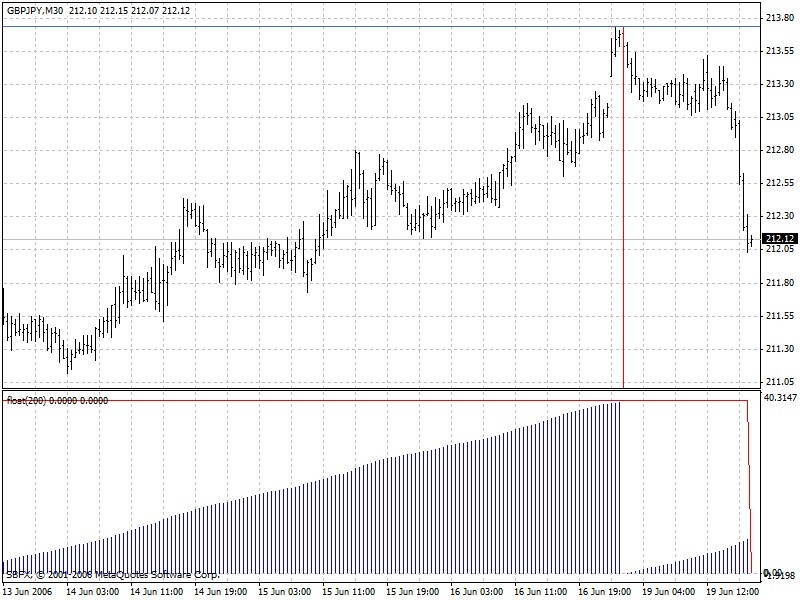
This Float indicator is completely useless for the trading you want to do.
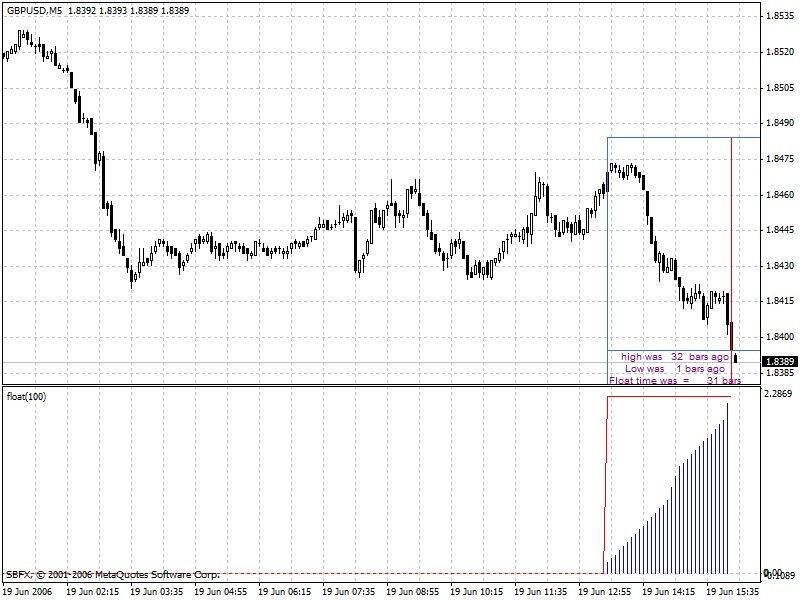
On the image you see many red vertical lines. Each of the vertical lines was a bar were the float indicator was saying to go short.
Even if one would wait for 1 confirmation bar then you still see that this would not help.
What the indicator does, you can do this for yourself. If price is going up after each bar you say: this was the top. Everytime when that top is broken you say again: oops sorry but this is the top. If you will say this long enough you will see that at some point you will be spot on (if you forget all the times that you were wrong).
This indicator is showing nothing more and nothing less then the low over a period of time and the high over a period of time. To build a strategy on this for scalping is impossible.
The only use I can see for this indicator is more the opposite.
For example: if you would place this indicator on a day chart and if price or the close of bar would break the previous low or high go long or short (ex. if price breaks true the high of the last 3 days then go long)
Or as a stoploss or trailing stop. When you are in a long position based on a day chart and price would fall down true the low of the last 3 days then exit.
The zig-zag indicator can tell you the same as what the float indicator tells you (light blue line). The last leg of the zig-zag indicator is dynamic and for thse reason useless for trading or for timing entrys. The same goes for the float indicator.
friendly regards..iGoR
- Free trading apps
- Over 8,000 signals for copying
- Economic news for exploring financial markets
You agree to website policy and terms of use
Lately I find out Float indicator, I realized that it can predict a change in the trend direction really good. I am using it in GBPUSD on 5M chart.
It giving me at least 10-50 pips every day. It missed sometimes and give u early alarm, but if u wait for a confirmation bar, u can be right most of the times.
The attached image can explain the system.
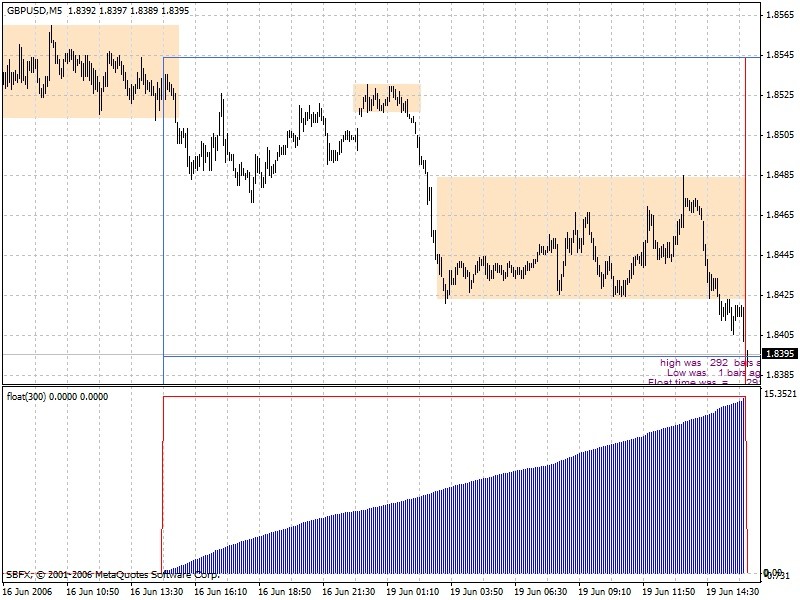
As u can check the 2nd signal was too early, and we exit with S/L, but we make enough pips in the 1st trade.
Eli