Difference in data/charts from different brokers and consequences.
Data is different. Especially on hig/low.
Should be the same on D1 close bar.
Alpari is similar with North Finance.
IBFX is different from Alpari.
This difference is just 1, 2 or 3 pips on closed bar.
Sometimes. Not all the time.
And there is the spikes as well.
Less with Alpari, more with IBFX.
But sometimes. Not all the time.
It is well-known information.
Many forums are connected with particular broker and usually they do not care about it. Our forum is not related to any broker so we may discuss it more easy.
It is more important for EAs than manual trading systems.
One example is Daytrading EA which is showing defferent results with Alpari.
Exact opposite situation is with Goldwarrior which was developed using Alpari data and showing the different results with IBFX for example.
How to protect your EA?
Some people is using pending orders.
The other decision is to use daily close bar in EA (for direction, for the calculation and so on). Or trade on D1.
FOREX data feed differences
hi,
I used the historical datafeed from dukascopy(a swiss broker) for backtesting
(http://www.dukascopy.com/swiss/engl...sv_data_export/)
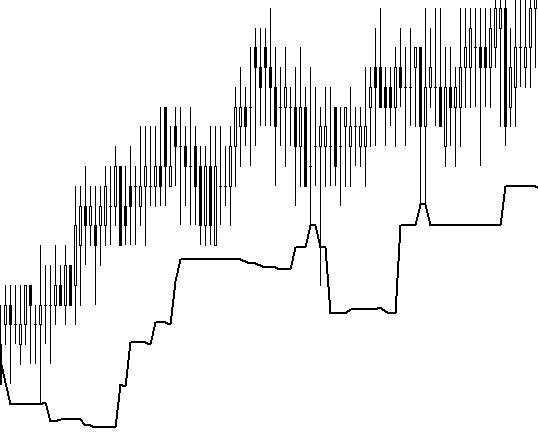
My trading systems which are based on High and Low values really worked well with THAT data. However, I used InterbankFX with MetaTrader because Dukascopy does not use MT and InterbankFX's data feed was totally different.  The "wicks" of the candles were way shorter, mostly there was just a candleStickBody! Sometimes Open, Close, High and Low were the same. So with this data my trading system doesn't work at all.
2nd question: Why Is dukascopy's data so different? Is it better? Are these highs and lows in dukascopy's data real, tradeable quotes? And why does Dukascopy still have so good data on friday nights and Interbankfx doesn't? Can I really trade totally different prices for EUR/USD depending on my broker?
And now I am looking for some other broker which offers some similar data with long TRADEABLE wicks.
3rd question: Is dukascopy's data just made up? And how can the data of two brokers be so different? Do you know any other broker which uses MT, has low spreads (1-3 pips) and a low minimum deposit?
I know, these are many questions but please help me anyways. I posted this thread here because I think there are some really smart and experience guys around here.
Attached are some different data pieces of EUR/USD 1 min from dukascopy and interbankfx. I know, actually you can't compare them but even if you take the exact same day and minute then it looks like this too.
Low / High
Do you guys know a broker which offers data like dukascopy - candle with long wicks (see the attachment) ? That is really important for my trading system :/
The brokers I had srv. files of just had these short-wicked candles and they suck...And do you think you can definitely trade every high and every low?
Your comment on this is much appreciated!
Different data, different results?
I normally use my broker data for my pattern recognition but sometimes for various reasons use metaquotes data which i find the patterns to be more profitable, the same as Alpari data is awful. Any body else find this?
- Free trading apps
- Over 8,000 signals for copying
- Economic news for exploring financial markets
You agree to website policy and terms of use
I notice huge difference in data/charts from different brokers, sometimes the difference is up to 4-8 pips in both directions on 15min charts, less on 1-5min. That means by using the same system or EA with one broker you making money when with the other you are loosing. What is the explanation?
Please see examples below (5min)
a)FIBO uk
b)NorthFinance
c)Meataquotes demo