Request SIMPLE EA using StepMA_Stoch_V1
The chart I posted previously was missing two trades:
Long 2006.03.30 12:00
Short 2006.03.31 09:45
This attached chart shows those trades (Green Vertical line Long, Red Vertical Line Short)
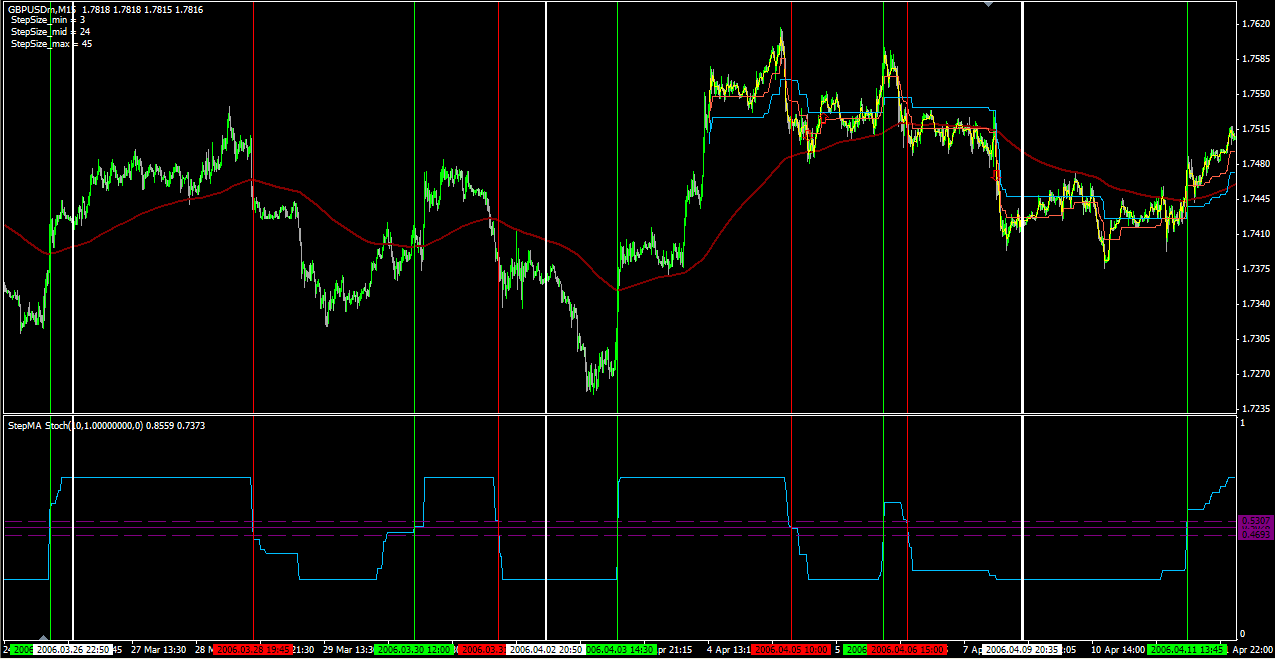
It would help if you posted the indicators and made a template with markups.
just my 2cents
Only 1 indicator as mentioned above, attached. As far as a template is concerned, not exactly sure what you mean but the EA explanation is below:
Long Trade-
1)On 15min chart with StepMA_Stoch_V1, go Long when Sky Blue line (StepMA Stoch 2) crosses above 50.
2)Trade 3 lots.
3)Take profit for 1st lot at 50 pips. Take profit for 2nd lot at 100 pips.
4)After 2nd trade closes at 100 pips, trail market with 50 pip trailing stop to reach 200+ pips for 3rd lot.
5)There is no predetermined StopLoss, and this is why: After Sky Blue StepMA_Stoch_V1 crosses back below 50, close open trade and reverse direction!
Short Trade-
1)On 15min chart with StepMA_Stoch_V1, go Short when Sky Blue line (StepMA Stoch 2) crosses below 50.
2)Trade 3 lots.
3)Take profit for 1st lot at 50 pips. Take profit for 2nd lot at 100 pips.
4)After 2nd trade closes at 100 pips, trail market with 50 pip trailing stop to reach 200+ pips for 3rd lot.
5)There is no initial predetermined StopLoss, and this is why: After Sky Blue StepMA_Stoch_V1 crosses back above 50, close open trades and reverse direction!
- Free trading apps
- Over 8,000 signals for copying
- Economic news for exploring financial markets
You agree to website policy and terms of use
Greetings fellow Forex-TSDers!!!
I would like to share a simple trading plan with my friends here at Forex-TSD, and request some of the great programming minds develop an EA based on the system. It is a longer term trading strategy, most of the great profits occur over a 3-8 day period. Profit targets are 50, 100, and 200 pips. This means no watching every tick!!!
Here it is:
Long Trade-
1)On 15min chart with StepMA_Stoch_V1, go Long when Sky Blue line (StepMA Stoch 2) crosses above 50.
2)Trade 3 lots.
3)Take profit for 1st lot at 50 pips. Take profit for 2nd lot at 100 pips.
4)After 2nd trade closes at 100 pips, trail market with 50 pip trailing stop to reach 200+ pips for 3rd lot.
5)There is no predetermined StopLoss, and this is why: After Sky Blue StepMA_Stoch_V1 crosses back below 50, close open trade and reverse direction!
Short Trade-
1)On 15min chart with StepMA_Stoch_V1, go Short when Sky Blue line (StepMA Stoch 2) crosses below 50.
2)Trade 3 lots.
3)Take profit for 1st lot at 50 pips. Take profit for 2nd lot at 100 pips.
4)After 2nd trade closes at 100 pips, trail market with 50 pip trailing stop to reach 200+ pips for 3rd lot.
5)There is no initial predetermined StopLoss, and this is why: After Sky Blue StepMA_Stoch_V1 crosses back above 50, close open trades and reverse direction!
OK, I know this sounds very simple. This is for long-term trading, and you will be very pleased to see HOW GREAT THIS UNIQUE INDICATOR CREATED BY A DEDICATED MEMBER OF THIS FORUM catches great trades IN BOTH RANGING AND TRENDING MARKETS.
I have attached a chart image for you to see for yourself. The green vertical lines represent Long trades, and the red vertical lines represent Short trades. The thicker white lines represent the start of a new week.
Plz consider this method worthy of EA development! All constructive feedback and thoughts are welcome!!!