Gartley 222
who can convert from Tradestation to metatrader here is the code:
TradeStation code for Gartley 222 pattern found in "Trading the Gartley 222" by Aaron Behle and Mark Conway, p. 38:
Inputs:
Length(100),
Strength(8),
Tolerance(0.10),
BullColor(Blue),
BearColor(Red);
Variables:
F1(0.618),
F2(0.786),
F3(1.27),
F4(1.618),
P1Bar(-1),
P2Bar(-1),
T1Bar(-1),
T2Bar(-1),
P1(0.0),
P2(0.0),
T1(0.0),
T2(0.0),
PTValid(False),
HLValid(False),
InZone(False),
GD(0.0),
XA(0.0),
AB(0.0),
BC(0.0),
CD(0.0),
AD(0.0),
C1(False),
C2(False),
C3(False),
C4(False),
ABdXA(0.0),
BCdAB(0.0),
CDdBC(0.0),
ADdXA(0.0),
TL1(-1),
TL2(-1),
TL3(-1),
TL4(-1),
TL5(-1),
TL6(-1);
P1Bar = SwingHighBar(1, High, Strength, Length);
P2Bar = SwingHighBar(2, High, Strength, Length);
T1Bar = SwingLowBar(1, Low, Strength, Length);
T2Bar = SwingLowBar(2, Low, Strength, Length);
If P1Bar -1 and
P2Bar -1 and
T1Bar -1 and
T2Bar -1 Then Begin
{Test for a bullish 222}
{Trough X is T2}
T2 = Low[T2Bar];
{Peak A is P2}
P2 = High[P2Bar];
{Trough B is T1}
T1 = Low[T1Bar];
{Peak C is P1}
P1 = High[P1Bar];
{D is the buy point}
GD = Low;
PTValid = P1Bar < T1Bar and T1Bar < P2Bar and P2Bar < T2Bar;
HLValid = P1 T2 and P1 > T1;
InZone = GD T2 and P2 >= Highest(High, T2Bar);
If PTValid and HLValid and InZone Then Begin
XA = P2 - T2;
AB = P2 - T1;
BC = P1 - T1;
CD = P1 - GD;
AD = P2 - GD;
ABdXA = AB / XA; {AB should be 61.8% of XA}
C1 = ABdXA > F1 - Tolerance and ABdXA < F1 + Tolerance;
BCdAB = BC / AB; {BC should be 61.8-78.6% of AB}
C2 = BCdAB > F1 - Tolerance and BCdAB < F2 + Tolerance;
CDdBC = CD / BC; {CD should be 127-161.8% of BC}
C3 = CDdBC > F3 - Tolerance and CDdBC < F4 + Tolerance;
ADdXA = AD / XA; {AD should be 78.6% of XA}
C4 = ADdXA > F2 - Tolerance and ADdXA < F2 + Tolerance;
If C1 and C2 and C3 and C4 Then Begin
TL1 = TL_New(Date[T2Bar], Time[T2Bar], T2, Date[P2Bar], Time[P2Bar], P2);
If TL1 >= 0 Then Begin
TL_SetColor(TL1, BullColor);
TL_SetStyle(TL1, Tool_Solid);
TL_SetSize(TL1, 2);
End;
TL2 = TL_New(Date[P2Bar], Time[P2Bar], P2, Date[T1Bar], Time[T1Bar], T1);
If TL2 >= 0 Then Begin
TL_SetColor(TL2, BullColor);
TL_SetStyle(TL2, Tool_Solid);
TL_SetSize(TL2, 2);
End;
TL3 = TL_New(Date[T1Bar], Time[T1Bar], T1, Date[P1Bar], Time[P1Bar], P1);
If TL3 >= 0 Then Begin
TL_SetColor(TL3, BullColor);
TL_SetStyle(TL3, Tool_Solid);
TL_SetSize(TL3, 2);
End;
TL4 = TL_New(Date[P1Bar], Time[P1Bar], P1, Date, Time, GD);
If TL4 >= 0 Then Begin
TL_SetColor(TL4, BullColor);
TL_SetStyle(TL4, Tool_Solid);
TL_SetSize(TL4, 2);
End;
TL5 = TL_New(Date[T1Bar], Time[T1Bar], T1, Date, Time, GD);
If TL5 >= 0 Then Begin
TL_SetColor(TL5, BullColor);
TL_SetStyle(TL5, Tool_Dotted);
End;
TL6 = TL_New(Date[T2Bar], Time[T2Bar], T2, Date, Time, GD);
If TL6 >= 0 Then Begin
TL_SetColor(TL6, BullColor);
TL_SetStyle(TL6, Tool_Dotted);
End;
End;
End;
{Test for a bearish 222}
{Peak X is P2}
{Trough A is T2}
{Peak B is P1}
{Trough C is T1}
{GD is the short point}
GD = High;
PTValid = T1Bar < P1Bar and P1Bar < T2Bar and T2Bar < P2Bar;
HLValid = T1 > T2 and P1 < P2 and T1 < P1;
InZone = GD > P1 and GD < P2 and T2 <= Lowest(Low, P2Bar);
If PTValid and HLValid and InZone Then Begin
XA = P2 - T2;
AB = P1 - T2;
BC = P1 - T1;
CD = GD - T1;
AD = GD - T2;
ABdXA = AB / XA; {AB should be 61.8% of XA}
C1 = ABdXA > F1 - Tolerance and ABdXA < F1 + Tolerance;
BCdAB = BC / AB; {BC should be 61.8-78.6% of AB}
C2 = BCdAB > F1 - Tolerance and BCdAB < F2 + Tolerance;
CDdBC = CD / BC; {CD should be 127-161.8% of BC}
C3 = CDdBC > F3 - Tolerance and CDdBC < F4 + Tolerance;
ADdXA = AD / XA; {AD should be 78.6% of XA}
C4 = ADdXA > F2 - Tolerance and ADdXA < F2 + Tolerance;
If C1 and C2 and C3 and C4 Then Begin
TL1 = TL_New(Date[P2Bar], Time[P2Bar], P2, Date[T2Bar], Time[T2Bar], T2);
If TL1 >= 0 Then Begin
TL_SetColor(TL1, BearColor);
TL_SetStyle(TL1, Tool_Solid);
TL_SetSize(TL1, 2);
End;
TL2 = TL_New(Date[T2Bar], Time[T2Bar], T2, Date[P1Bar], Time[P1Bar], P1);
If TL2 >= 0 Then Begin
TL_SetColor(TL2, BearColor);
TL_SetStyle(TL2, Tool_Solid);
TL_SetSize(TL2, 2);
End;
TL3 = TL_New(Date[P1Bar], Time[P1Bar], P1, Date[T1Bar], Time[T1Bar], T1);
If TL3 >= 0 Then Begin
TL_SetColor(TL3, BearColor);
TL_SetStyle(TL3, Tool_Solid);
TL_SetSize(TL3, 2);
End;
TL4 = TL_New(Date[T1Bar], Time[T1Bar], T1, Date, Time, GD);
If TL4 >= 0 Then Begin
TL_SetColor(TL4, BearColor);
TL_SetStyle(TL4, Tool_Solid);
TL_SetSize(TL4, 2);
End;
TL5 = TL_New(Date[P1Bar], Time[P1Bar], P1, Date, Time, GD);
If TL5 >= 0 Then Begin
TL_SetColor(TL5, BearColor);
TL_SetStyle(TL5, Tool_Dotted);
End;
TL6 = TL_New(Date[P2Bar], Time[P2Bar], P2, Date, Time, GD);
If TL6 >= 0 Then Begin
TL_SetColor(TL6, BearColor);
TL_SetStyle(TL6, Tool_Dotted);
End;
End;
End;
End;[/CODE]
Or from Wealth-Lab code to metatrader4:
[CODE]procedure Gartley222
(
VPFactor: float;
Tolerance: float;
Lookback: integer;
HoldBars: integer;
VolMin: integer
);
begin
var ATRValue, VP, Reversal: float;
var F1, F2, F3, F4, P1, P2, T1, T2: float;
var Bar, P1Bar, P2Bar, T1Bar, T2Bar, p: integer;
var XA, AB, BC, CD, AD, D, XD, DT, ABdXA, BCdAB, CDdBC, ADdXA: float;
var PTValid, HLValid, InZone, C1, C2, C3, C4: boolean;
var BT, BS, ST, SS: float;
{Fibonacci Constants}
F1 := 0.618;
F2 := 0.786;
F3 := 1.27;
F4 := 1.618;
InstallTimeBasedExit(HoldBars);
for Bar := Lookback to BarCount() - 1 do
begin
ApplyAutoStops(Bar);
ATRValue := ATR(Bar, Lookback);
SetShareSize( 1000 * Int( 10 / ATRValue ) );
VP := 100 * ATRValue / PriceClose(Bar);
{Find peaks and troughs}
Reversal := Int(VPFactor * VP);
P1 := Peak(Bar, #High, F1 * Reversal);
P1Bar := PeakBar(Bar, #High, F1 * Reversal);
P2 := Peak(P1Bar, #High, Reversal);
P2Bar := PeakBar(P1Bar, #High, Reversal);
T1 := Trough(Bar, #Low, F1 * Reversal);
T1Bar := TroughBar(Bar, #Low, F1 * Reversal);
T2 := Trough(T1Bar, #Low, Reversal);
T2Bar := TroughBar(T1Bar, #Low, Reversal);
{Test for a bullish 222}
{Trough X is T2}
{Peak A is P2}
{Trough B is T1}
{Peak C is P1}
{D is the buy zone}
D := PriceLow(Bar);
PTValid := (P1Bar > T1Bar) and (T1Bar > P2Bar) and (P2Bar > T2Bar);
HLValid := (P1 T2) and (P1 > T1);
InZone := (D T2);
if (MarketPosition = 0) and
(SMA(Bar, #Volume, Lookback) >= VolMin) and
(PTValid) and (HLValid) and (InZone) then
begin
XA := P2 - T2;
AB := P2 - T1;
BC := P1 - T1;
XD := P2 - (F2 * XA);
CD := P1 - XD;
AD := P2 - XD;
ABdXA := AB / XA; {AB should be 61.8% of XA}
C1 := (ABdXA > F1 - Tolerance) and (ABdXA < F1 + Tolerance);
BCdAB := BC / AB; {BC should be 61.8-78.6% of AB}
C2 := (BCdAB > F1 - Tolerance) and (BCdAB < F2 + Tolerance);
CDdBC := CD / BC; {CD should be 127-161.8% of BC}
C3 := (CDdBC > F3 - Tolerance) and (CDdBC < F4 + Tolerance);
ADdXA := AD / XA; {AD should be 78.6% of XA}
C4 := (ADdXA > F2 - Tolerance) and (ADdXA < F2 + Tolerance);
if C1 and C2 and C3 and C4 then
begin
DrawLine(P2Bar, P2, T2Bar, T2, 0, #Blue, #Solid);
DrawLine(T1Bar, T1, P2Bar, P2, 0, #Blue, #Solid);
DrawLine(P1Bar, P1, T1Bar, T1, 0, #Blue, #Solid);
DrawLine(Bar, D, P1Bar, P1, 0, #Blue, #Solid);
DrawLine(Bar, D, T1Bar, T1, 0, #Blue, #Dotted);
DrawLine(Bar, D, T2Bar, T2, 0, #Blue, #Dotted);
AnnotateBar('B', Bar, True, #Blue, 10);
BuyAtLimit(Bar, XD, 'G222 LE');
DT := F1 * CD;
BT := XD + DT;
BS := T2;
end;
end;
{Test for a bearish 222}
{Peak X is P2}
{Trough A is T2}
{Peak B is P1}
{Trough C is T1}
{D is the short zone}
D := PriceHigh(Bar);
PTValid := (T1Bar > P1Bar) and (P1Bar > T2Bar) and (T2Bar > P2Bar);
HLValid := (T1 > T2) and (P1 < P2) and (T1 < P1);
InZone := (D > P1) and (D < P2);
if (MarketPosition = 0) and
(PriceClose( Bar ) >= 5) and
(SMA(Bar, #Volume, Lookback) >= VolMin) and
(PTValid) and (HLValid) and (InZone) then
begin
XA := P2 - T2;
AB := P1 - T2;
BC := P1 - T1;
XD := T2 + (F2 * XA);
CD := XD - T1;
AD := XD - T2;
ABdXA := AB / XA; {AB should be 61.8% of XA}
C1 := (ABdXA > F1 - Tolerance) and (ABdXA < F1 + Tolerance);
BCdAB := BC / AB; {BC should be 61.8-78.6% of AB}
C2 := (BCdAB > F1 - Tolerance) and (BCdAB < F2 + Tolerance);
CDdBC := CD / BC; {CD should be 127-161.8% of BC}
C3 := (CDdBC > F3 - Tolerance) and (CDdBC < F4 + Tolerance);
ADdXA := AD / XA; {AD should be 78.6% of XA}
C4 := (ADdXA > F2 - Tolerance) and (ADdXA < F2 + Tolerance);
if C1 and C2 and C3 and C4 then
begin
DrawLine(T2Bar, T2, P2Bar, P2, 0, #Red, #Solid);
DrawLine(P1Bar, P1, T2Bar, T2, 0, #Red, #Solid);
DrawLine(T1Bar, T1, P1Bar, P1, 0, #Red, #Solid);
DrawLine(Bar, D, T1Bar, T1, 0, #Red, #Solid);
DrawLine(Bar, D, P1Bar, P1, 0, #Red, #Dotted);
DrawLine(Bar, D, P2Bar, P2, 0, #Red, #Dotted);
AnnotateBar('S', Bar, False, #Red, 10);
ShortAtLimit(Bar, XD, 'G222 SE');
DT := F1 * CD;
ST := XD - DT;
SS := P2;
end;
end;
if LastPositionActive then
begin
if MarketPosition = 1 then begin
SellAtLimit(Bar+1, BT, #All, 'G222 LX+');
SellAtStop(Bar+1, BS, #All, 'G222 LX-');
end;
if MarketPosition = -1 then begin
CoverAtLimit(Bar+1, ST, #All, 'G222 LX+');
CoverAtStop(Bar+1, SS, #All, 'G222 LX-');
end;
end;
end;
end;
Gartley222(2.0, 0.1, 20, 7, 2000000);hmm they should have provided Metatrader code too somebody must have this indicator so anybody having this indicator can share?
maybe is not posible to have this on metatrader4
maybe is not posible to have this on metatrader4
hello leutzuro,
i know everything is possible given the platform provides the development environment such as MT4 i am not a good programmer but i will try to create something out of this code thank you for sharing
i know there are some great programmers here if some one can convert this would be helpful for learning and trading
hello leutzuro,
i know everything is possible given the platform provides the development environment such as MT4 i am not a good programmer but i will try to create something out of this code thank you for sharing
i know there are some great programmers here if some one can convert this would be helpful for learning and tradingHello leutzuro
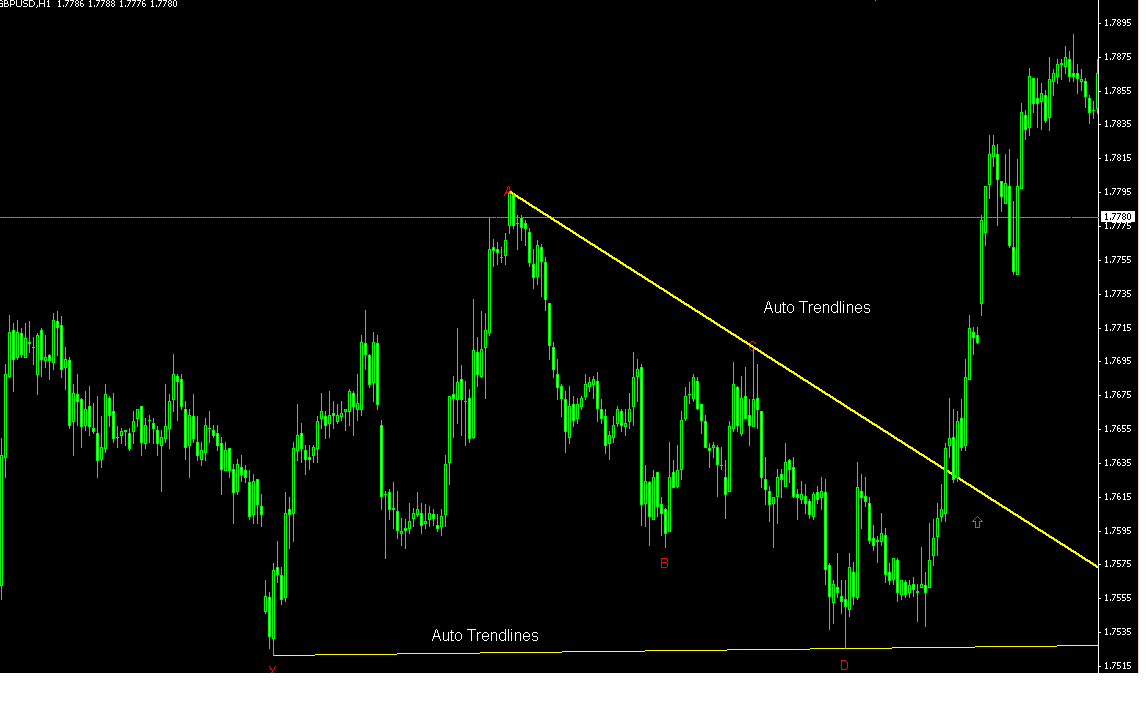
 my first attempt of creating this indicator
pattern was created on 1 hr gbp-usd some time ago where entry was at Jan20 ( not gartley way since i still cant program this properly yet)
trendlines are drawn automatically
This is not 100% Gartley maybe not even 60% but it worked that day  i am not good at programming and trying to fix it by whatever knowledge i have
i dont event know how to calculate distance between the points so i can start checking the retracements and right now it only give buy pattern.
hi super
thanks for your effort.i have an indicatore which is able to recognize butterfly pattern but it is wtitten for MT3.i attach it.perhaps it helps you to complete you work
and this is current at 5 min -- not taking any trades because i dont how will it work i will check the trendlines. The problem is 1st it only right now creates for buying no selling second fractal maybe wrong so dont know
Funny thing or bug is that "D" will Keep Changing to down down and down untill a low is created above the "X" and upper trendline is the entry ..confusing for me too but as i said not a programmer maybe new system thanks for the code kamyar i will check what i can do with it
Hello leutzuro
my first attempt of creating this indicator
pattern was created on 1 hr gbp-usd some time ago where entry was at Jan20 ( not gartley way since i still cant program this properly yet)
trendlines are drawn automatically
This is not 100% Gartley maybe not even 60% but it worked that day i am not good at programming and trying to fix it by whatever knowledge i have
and this is current at 5 min -- not taking any trades because i dont how will it work i will check the trendlines. The problem is 1st it only right now creates for buying no selling second fractal maybe wrong so dont know
great work man
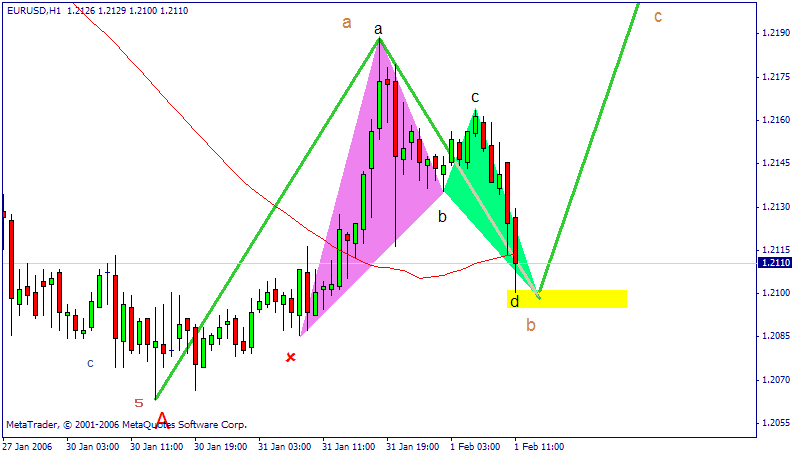
super-newbie check EUR/USD with your indicator what have now an see if works like in this image because we have this pattern right now
hello
nope no pattern , not even a single line and that is because it is not progarammed yet properly i have a signal on euro also last for Jan 20 breakout in 1 hr after that zilch its like sleeping in 5 minutes alot of noise signals and they ofcourse not working there must be lots of bugs which i am looking at right now
- Free trading apps
- Over 8,000 signals for copying
- Economic news for exploring financial markets
You agree to website policy and terms of use
who can convert from Tradestation to metatrader here is the code:
TradeStation code for Gartley 222 pattern found in "Trading the Gartley 222" by Aaron Behle and Mark Conway, p. 38:
Inputs:
Length(100),
Strength(8),
Tolerance(0.10),
BullColor(Blue),
BearColor(Red);
Variables:
F1(0.618),
F2(0.786),
F3(1.27),
F4(1.618),
P1Bar(-1),
P2Bar(-1),
T1Bar(-1),
T2Bar(-1),
P1(0.0),
P2(0.0),
T1(0.0),
T2(0.0),
PTValid(False),
HLValid(False),
InZone(False),
GD(0.0),
XA(0.0),
AB(0.0),
BC(0.0),
CD(0.0),
AD(0.0),
C1(False),
C2(False),
C3(False),
C4(False),
ABdXA(0.0),
BCdAB(0.0),
CDdBC(0.0),
ADdXA(0.0),
TL1(-1),
TL2(-1),
TL3(-1),
TL4(-1),
TL5(-1),
TL6(-1);
P1Bar = SwingHighBar(1, High, Strength, Length);
P2Bar = SwingHighBar(2, High, Strength, Length);
T1Bar = SwingLowBar(1, Low, Strength, Length);
T2Bar = SwingLowBar(2, Low, Strength, Length);
If P1Bar -1 and
P2Bar -1 and
T1Bar -1 and
T2Bar -1 Then Begin
{Test for a bullish 222}
{Trough X is T2}
T2 = Low[T2Bar];
{Peak A is P2}
P2 = High[P2Bar];
{Trough B is T1}
T1 = Low[T1Bar];
{Peak C is P1}
P1 = High[P1Bar];
{D is the buy point}
GD = Low;
PTValid = P1Bar < T1Bar and T1Bar < P2Bar and P2Bar < T2Bar;
HLValid = P1 T2 and P1 > T1;
InZone = GD T2 and P2 >= Highest(High, T2Bar);
If PTValid and HLValid and InZone Then Begin
XA = P2 - T2;
AB = P2 - T1;
BC = P1 - T1;
CD = P1 - GD;
AD = P2 - GD;
ABdXA = AB / XA; {AB should be 61.8% of XA}
C1 = ABdXA > F1 - Tolerance and ABdXA < F1 + Tolerance;
BCdAB = BC / AB; {BC should be 61.8-78.6% of AB}
C2 = BCdAB > F1 - Tolerance and BCdAB < F2 + Tolerance;
CDdBC = CD / BC; {CD should be 127-161.8% of BC}
C3 = CDdBC > F3 - Tolerance and CDdBC < F4 + Tolerance;
ADdXA = AD / XA; {AD should be 78.6% of XA}
C4 = ADdXA > F2 - Tolerance and ADdXA < F2 + Tolerance;
If C1 and C2 and C3 and C4 Then Begin
TL1 = TL_New(Date[T2Bar], Time[T2Bar], T2, Date[P2Bar], Time[P2Bar], P2);
If TL1 >= 0 Then Begin
TL_SetColor(TL1, BullColor);
TL_SetStyle(TL1, Tool_Solid);
TL_SetSize(TL1, 2);
End;
TL2 = TL_New(Date[P2Bar], Time[P2Bar], P2, Date[T1Bar], Time[T1Bar], T1);
If TL2 >= 0 Then Begin
TL_SetColor(TL2, BullColor);
TL_SetStyle(TL2, Tool_Solid);
TL_SetSize(TL2, 2);
End;
TL3 = TL_New(Date[T1Bar], Time[T1Bar], T1, Date[P1Bar], Time[P1Bar], P1);
If TL3 >= 0 Then Begin
TL_SetColor(TL3, BullColor);
TL_SetStyle(TL3, Tool_Solid);
TL_SetSize(TL3, 2);
End;
TL4 = TL_New(Date[P1Bar], Time[P1Bar], P1, Date, Time, GD);
If TL4 >= 0 Then Begin
TL_SetColor(TL4, BullColor);
TL_SetStyle(TL4, Tool_Solid);
TL_SetSize(TL4, 2);
End;
TL5 = TL_New(Date[T1Bar], Time[T1Bar], T1, Date, Time, GD);
If TL5 >= 0 Then Begin
TL_SetColor(TL5, BullColor);
TL_SetStyle(TL5, Tool_Dotted);
End;
TL6 = TL_New(Date[T2Bar], Time[T2Bar], T2, Date, Time, GD);
If TL6 >= 0 Then Begin
TL_SetColor(TL6, BullColor);
TL_SetStyle(TL6, Tool_Dotted);
End;
End;
End;
{Test for a bearish 222}
{Peak X is P2}
{Trough A is T2}
{Peak B is P1}
{Trough C is T1}
{GD is the short point}
GD = High;
PTValid = T1Bar < P1Bar and P1Bar < T2Bar and T2Bar < P2Bar;
HLValid = T1 > T2 and P1 < P2 and T1 < P1;
InZone = GD > P1 and GD < P2 and T2 <= Lowest(Low, P2Bar);
If PTValid and HLValid and InZone Then Begin
XA = P2 - T2;
AB = P1 - T2;
BC = P1 - T1;
CD = GD - T1;
AD = GD - T2;
ABdXA = AB / XA; {AB should be 61.8% of XA}
C1 = ABdXA > F1 - Tolerance and ABdXA < F1 + Tolerance;
BCdAB = BC / AB; {BC should be 61.8-78.6% of AB}
C2 = BCdAB > F1 - Tolerance and BCdAB < F2 + Tolerance;
CDdBC = CD / BC; {CD should be 127-161.8% of BC}
C3 = CDdBC > F3 - Tolerance and CDdBC < F4 + Tolerance;
ADdXA = AD / XA; {AD should be 78.6% of XA}
C4 = ADdXA > F2 - Tolerance and ADdXA < F2 + Tolerance;
If C1 and C2 and C3 and C4 Then Begin
TL1 = TL_New(Date[P2Bar], Time[P2Bar], P2, Date[T2Bar], Time[T2Bar], T2);
If TL1 >= 0 Then Begin
TL_SetColor(TL1, BearColor);
TL_SetStyle(TL1, Tool_Solid);
TL_SetSize(TL1, 2);
End;
TL2 = TL_New(Date[T2Bar], Time[T2Bar], T2, Date[P1Bar], Time[P1Bar], P1);
If TL2 >= 0 Then Begin
TL_SetColor(TL2, BearColor);
TL_SetStyle(TL2, Tool_Solid);
TL_SetSize(TL2, 2);
End;
TL3 = TL_New(Date[P1Bar], Time[P1Bar], P1, Date[T1Bar], Time[T1Bar], T1);
If TL3 >= 0 Then Begin
TL_SetColor(TL3, BearColor);
TL_SetStyle(TL3, Tool_Solid);
TL_SetSize(TL3, 2);
End;
TL4 = TL_New(Date[T1Bar], Time[T1Bar], T1, Date, Time, GD);
If TL4 >= 0 Then Begin
TL_SetColor(TL4, BearColor);
TL_SetStyle(TL4, Tool_Solid);
TL_SetSize(TL4, 2);
End;
TL5 = TL_New(Date[P1Bar], Time[P1Bar], P1, Date, Time, GD);
If TL5 >= 0 Then Begin
TL_SetColor(TL5, BearColor);
TL_SetStyle(TL5, Tool_Dotted);
End;
TL6 = TL_New(Date[P2Bar], Time[P2Bar], P2, Date, Time, GD);
If TL6 >= 0 Then Begin
TL_SetColor(TL6, BearColor);
TL_SetStyle(TL6, Tool_Dotted);
End;
End;
End;
End;[/CODE]
Or from Wealth-Lab code to metatrader4:
[CODE]procedure Gartley222
(
VPFactor: float;
Tolerance: float;
Lookback: integer;
HoldBars: integer;
VolMin: integer
);
begin
var ATRValue, VP, Reversal: float;
var F1, F2, F3, F4, P1, P2, T1, T2: float;
var Bar, P1Bar, P2Bar, T1Bar, T2Bar, p: integer;
var XA, AB, BC, CD, AD, D, XD, DT, ABdXA, BCdAB, CDdBC, ADdXA: float;
var PTValid, HLValid, InZone, C1, C2, C3, C4: boolean;
var BT, BS, ST, SS: float;
{Fibonacci Constants}
F1 := 0.618;
F2 := 0.786;
F3 := 1.27;
F4 := 1.618;
InstallTimeBasedExit(HoldBars);
for Bar := Lookback to BarCount() - 1 do
begin
ApplyAutoStops(Bar);
ATRValue := ATR(Bar, Lookback);
SetShareSize( 1000 * Int( 10 / ATRValue ) );
VP := 100 * ATRValue / PriceClose(Bar);
{Find peaks and troughs}
Reversal := Int(VPFactor * VP);
P1 := Peak(Bar, #High, F1 * Reversal);
P1Bar := PeakBar(Bar, #High, F1 * Reversal);
P2 := Peak(P1Bar, #High, Reversal);
P2Bar := PeakBar(P1Bar, #High, Reversal);
T1 := Trough(Bar, #Low, F1 * Reversal);
T1Bar := TroughBar(Bar, #Low, F1 * Reversal);
T2 := Trough(T1Bar, #Low, Reversal);
T2Bar := TroughBar(T1Bar, #Low, Reversal);
{Test for a bullish 222}
{Trough X is T2}
{Peak A is P2}
{Trough B is T1}
{Peak C is P1}
{D is the buy zone}
D := PriceLow(Bar);
PTValid := (P1Bar > T1Bar) and (T1Bar > P2Bar) and (P2Bar > T2Bar);
HLValid := (P1 T2) and (P1 > T1);
InZone := (D T2);
if (MarketPosition = 0) and
(SMA(Bar, #Volume, Lookback) >= VolMin) and
(PTValid) and (HLValid) and (InZone) then
begin
XA := P2 - T2;
AB := P2 - T1;
BC := P1 - T1;
XD := P2 - (F2 * XA);
CD := P1 - XD;
AD := P2 - XD;
ABdXA := AB / XA; {AB should be 61.8% of XA}
C1 := (ABdXA > F1 - Tolerance) and (ABdXA < F1 + Tolerance);
BCdAB := BC / AB; {BC should be 61.8-78.6% of AB}
C2 := (BCdAB > F1 - Tolerance) and (BCdAB < F2 + Tolerance);
CDdBC := CD / BC; {CD should be 127-161.8% of BC}
C3 := (CDdBC > F3 - Tolerance) and (CDdBC < F4 + Tolerance);
ADdXA := AD / XA; {AD should be 78.6% of XA}
C4 := (ADdXA > F2 - Tolerance) and (ADdXA < F2 + Tolerance);
if C1 and C2 and C3 and C4 then
begin
DrawLine(P2Bar, P2, T2Bar, T2, 0, #Blue, #Solid);
DrawLine(T1Bar, T1, P2Bar, P2, 0, #Blue, #Solid);
DrawLine(P1Bar, P1, T1Bar, T1, 0, #Blue, #Solid);
DrawLine(Bar, D, P1Bar, P1, 0, #Blue, #Solid);
DrawLine(Bar, D, T1Bar, T1, 0, #Blue, #Dotted);
DrawLine(Bar, D, T2Bar, T2, 0, #Blue, #Dotted);
AnnotateBar('B', Bar, True, #Blue, 10);
BuyAtLimit(Bar, XD, 'G222 LE');
DT := F1 * CD;
BT := XD + DT;
BS := T2;
end;
end;
{Test for a bearish 222}
{Peak X is P2}
{Trough A is T2}
{Peak B is P1}
{Trough C is T1}
{D is the short zone}
D := PriceHigh(Bar);
PTValid := (T1Bar > P1Bar) and (P1Bar > T2Bar) and (T2Bar > P2Bar);
HLValid := (T1 > T2) and (P1 < P2) and (T1 < P1);
InZone := (D > P1) and (D < P2);
if (MarketPosition = 0) and
(PriceClose( Bar ) >= 5) and
(SMA(Bar, #Volume, Lookback) >= VolMin) and
(PTValid) and (HLValid) and (InZone) then
begin
XA := P2 - T2;
AB := P1 - T2;
BC := P1 - T1;
XD := T2 + (F2 * XA);
CD := XD - T1;
AD := XD - T2;
ABdXA := AB / XA; {AB should be 61.8% of XA}
C1 := (ABdXA > F1 - Tolerance) and (ABdXA < F1 + Tolerance);
BCdAB := BC / AB; {BC should be 61.8-78.6% of AB}
C2 := (BCdAB > F1 - Tolerance) and (BCdAB < F2 + Tolerance);
CDdBC := CD / BC; {CD should be 127-161.8% of BC}
C3 := (CDdBC > F3 - Tolerance) and (CDdBC < F4 + Tolerance);
ADdXA := AD / XA; {AD should be 78.6% of XA}
C4 := (ADdXA > F2 - Tolerance) and (ADdXA < F2 + Tolerance);
if C1 and C2 and C3 and C4 then
begin
DrawLine(T2Bar, T2, P2Bar, P2, 0, #Red, #Solid);
DrawLine(P1Bar, P1, T2Bar, T2, 0, #Red, #Solid);
DrawLine(T1Bar, T1, P1Bar, P1, 0, #Red, #Solid);
DrawLine(Bar, D, T1Bar, T1, 0, #Red, #Solid);
DrawLine(Bar, D, P1Bar, P1, 0, #Red, #Dotted);
DrawLine(Bar, D, P2Bar, P2, 0, #Red, #Dotted);
AnnotateBar('S', Bar, False, #Red, 10);
ShortAtLimit(Bar, XD, 'G222 SE');
DT := F1 * CD;
ST := XD - DT;
SS := P2;
end;
end;
if LastPositionActive then
begin
if MarketPosition = 1 then begin
SellAtLimit(Bar+1, BT, #All, 'G222 LX+');
SellAtStop(Bar+1, BS, #All, 'G222 LX-');
end;
if MarketPosition = -1 then begin
CoverAtLimit(Bar+1, ST, #All, 'G222 LX+');
CoverAtStop(Bar+1, SS, #All, 'G222 LX-');
end;
end;
end;
end;
Gartley222(2.0, 0.1, 20, 7, 2000000);