New Indicator/Strategy
No response, maybe I haven't demonstrated the potential for this simple indicator too well.
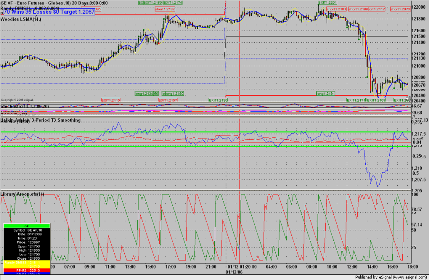
Attached is a screenshot of the last couple of days trading, the middle indicator is the one I have explained above (although with the bands set at +0.10 and -0.10), the bottom is Aroon.
Although slightly delayed, look at when the market is consolidating the indicator is within the bands (not trade), then look at the Long/Short trend indications with the clear indication of when the trend is weakening. Surely with a simple trend based entry system as I have said before, this is the basis for a trading strategy ?
I am sure that with a bit of programming, this is a useful tool !
No response, maybe I haven't demonstrated the potential for this simple indicator too well.
Attached is a screenshot of the last couple of days trading, the middle indicator is the one I have explained above (although with the bands set at +0.10 and -0.10), the bottom is Aroon.
Although slightly delayed, look at when the market is consolidating the indicator is within the bands (not trade), then look at the Long/Short trend indications with the clear indication of when the trend is weakening. Surely with a simple trend based entry system as I have said before, this is the basis for a trading strategy ?
I am sure that with a bit of programming, this is a useful tool !Can U post some bigger screenshot?
My pleasure, I beleive it is a Javascript derivative:
function preMain() {
setStudyTitle("Pro Go ");
setCursorLabelName("Pro Line", 0);
setCursorLabelName("Public Line", 1);
setDefaultBarThickness(1, 0);
setDefaultBarThickness(1, 1);
setDefaultBarFgColor(Color.blue, 0);
setDefaultBarFgColor(Color.red, 1);
var fp1 = new FunctionParameter("nProLength", FunctionParameter.NUMBER);
fp1.setName("Pro Length");
fp1.setLowerLimit(1);
fp1.setDefault(14);
var fp2 = new FunctionParameter("nPubLength", FunctionParameter.NUMBER);
fp2.setName("Public Length");
fp2.setLowerLimit(1);
fp2.setDefault(14);
}
var aPro = null;
var aPub = null;
var vPro = null;
var vPub = null;
function main(nProLength, nPubLength) {
var nState = getBarState();
var vC = close();
var vC1 = close(-1);
var vO = open();
if (vC == null || vC1 == null || vO == null) return;
if (aPro == null || aPub == null) {
aPro = new Array(nProLength);
aPub = new Array(nPubLength);
}
if (nState == BARSTATE_NEWBAR && vPro != null && vPub != null) {
aPro.pop();
aPub.pop();
aPro.unshift(vPro);
aPub.unshift(vPub);
}
vPro = ((vC-vO)/vO) * 1000;
aPro[0] = vPro;
vPub = ((vO-vC1)/vC1) * 1000;
aPub[0] = vPub;
if (aPro[nProLength-1] == null || aPub[nPubLength-1] == null) return;
var dProSum = 0;
var dPubSum = 0;
var cntr = Math.max(nProLength, nPubLength);
for (i = 0; i < cntr; ++i) {
if (i < nProLength) dProSum += aPro;
if (i < nPubLength) dPubSum += aPub;
}
var vProMA = dProSum/nProLength;
var vPubMA = dPubSum/nPubLength;
return new Array(vProMA, vPubMA);
}
My pleasure, I beleive it is a Javascript derivative:
Ok. Ty. Javascript is not a problem - i know a few programing languages.
But U was right in your first post.
Do you know if this indicator is currently written so as to re-paint bars, making it look more accurate than it is real time?
Thanks.
Thru
Its as live as they come, based on recent price action. It doesn't paint any bars though, just gives the indicator as I have displayed.
Do you know if this indicator is currently written so as to re-paint bars, making it look more accurate than it is real time?
Thanks.
ThruIncientally Thruline, you may see the potnetial in this like myself. If you wish to discuss it further, I would be interested.
- Free trading apps
- Over 8,000 signals for copying
- Economic news for exploring financial markets
You agree to website policy and terms of use
I have discovered an indicator that may be useful in MetaTrader used with something like SilverTrend or similar. Sadly though my MetaTrrader skills are non-existant so I have no way of sharing this indicator with you all, and perhaps developing a strategy from it.
I use the indicator to provide similar functionality to that of ADX/DMI, only this particular indicator is a lot faster. It basically can help to tell you when a market is in consolidation or trending. It can also determine the strength of the trend, direction of the trend and the potential weakening of the trend.
I think if this was used in conjuction with something like SilverTrend or ASCTrend we may have the basis for a strategy.
From what I can read of the code, the indicator works like this:
2 Variables are created (I will call the vA and vB) as follows:
vA = ((close - open)/open) * 1000
vB = ((open - previousclose)/previousclose) * 1000
Then simply a moving average of those calculations is calculated and plotted according to a user-defined length (for example 9 or 14).
The indicator would then work like this, I draw two bands on screen, one at +0.005 and the other at -0.005 (this is an arbitary figure). One indicator (I think its vB from memory) remains fairly constant and works almost like a 'zero' line, the other is more volatile (again I think this is vA). I then do not trade when vA is below +0.005 and above -0.005. Once vA breaks out of those bands, I would look for a SilverTrend entry in the direction of the breakout. When the trend starts to weaken then it is time to look for an exit.
If I could code this for everybody so that we could test, I would. But I think it might be a good basis for a strategy, although so far it is untested. If somebody wants to code this, it may be of interest to this forum.
BTW - Good forum, makes for some good reading.