Scalping Indicator - page 2
You are missing trading opportunities:
- Free trading apps
- Over 8,000 signals for copying
- Economic news for exploring financial markets
Registration
Log in
You agree to website policy and terms of use
If you do not have an account, please register
10 pip a day easy scalping system for the ftse
Ive been trading this for the last three months.
market - ftse100
charts. fxcm mt4 and IGmarkets advanced charts.
tf - one minute
when the market is bouncing in a small range trade the gaps on mt4 for one pip scalps only. a 10pip s/l will suffice as a catastrophic loss control. it will be rarely hit.
Before you start bombarding me with RvR of 10:1. I know that already.
But so long as you trade this when the market is ranging and you have checked for any uk related news not coming out, then you can easily pick off 10pips.
IF you see a gap on fxcms mt4 you need to confirm it on igmarkets advanced chart. It must be a minimum of 0.5 of a point on that chart too.
open a demo with fxcm, set the dealing window trading settings to 'single click' and limit of 1 (one). when price goes two pips away from a gap trade it. never trade for the gap to be closed. only to the edge of the gap. Often price will only come to the edge then bounce off.
This will make you money. i use it every day. from 10am-noon UKtime .
dont get greedy. 10pips a day is 50 a week and thats 200 a month. trading at a tenner a point gives you £2k/month. small bites at the cherry.
Have funFoxy
Could you point me to somewhere to get more information on how to trade this system
Cheers
Dave
Scalper signals
Scalper signals
Forex turbo scalper
Scalper signal 1.013D from here : Форекс индикатор Scalper Signal: сигнальный индикатор для скальпинга
scalpersignal_v1.013d.mq4
"Super scalper" version 5 superscalper05.mq4
Scalper fix
scalperfix.mq4
Hi Poster,
Unable to get the indicator to work - is there anything known that would stop it going on-chart as per your illustration.
Thanks
TEAMTRADER
"Super scalper" version 5 superscalper05.mq4
This would be a very solid, very safe, very SIMPLE 1m scalping system for those with the patience to scalp.
It ensures that you are scalping with the trend
The template is BHCS - which means :-
1. Background colour is first signal
2. HMA colours are second signal
3. CCI direction is third signal
4. Stochatics being overbought or oversold at the time of these signals is a BLOCK on the trade.
In the illustration the chart background is a sell, the HMA's are a sell but CCI signals a buy and stochastics signals oversold = no trade.
Indicators attached but can't attach the template as it is 'too large' according to the uploader at 3.78mb?
TEAMTRADER
PS - if interested please PM me with your email addres so I can send it via email.
Hi Poster,
Unable to get the indicator to work - is there anything known that would stop it going on-chart as per your illustration.
Thanks
TEAMTRADERI am using this and it works : superscalper05.mq4
Hello! My most interesting indicator =) Vertex - tool's 15 / 1000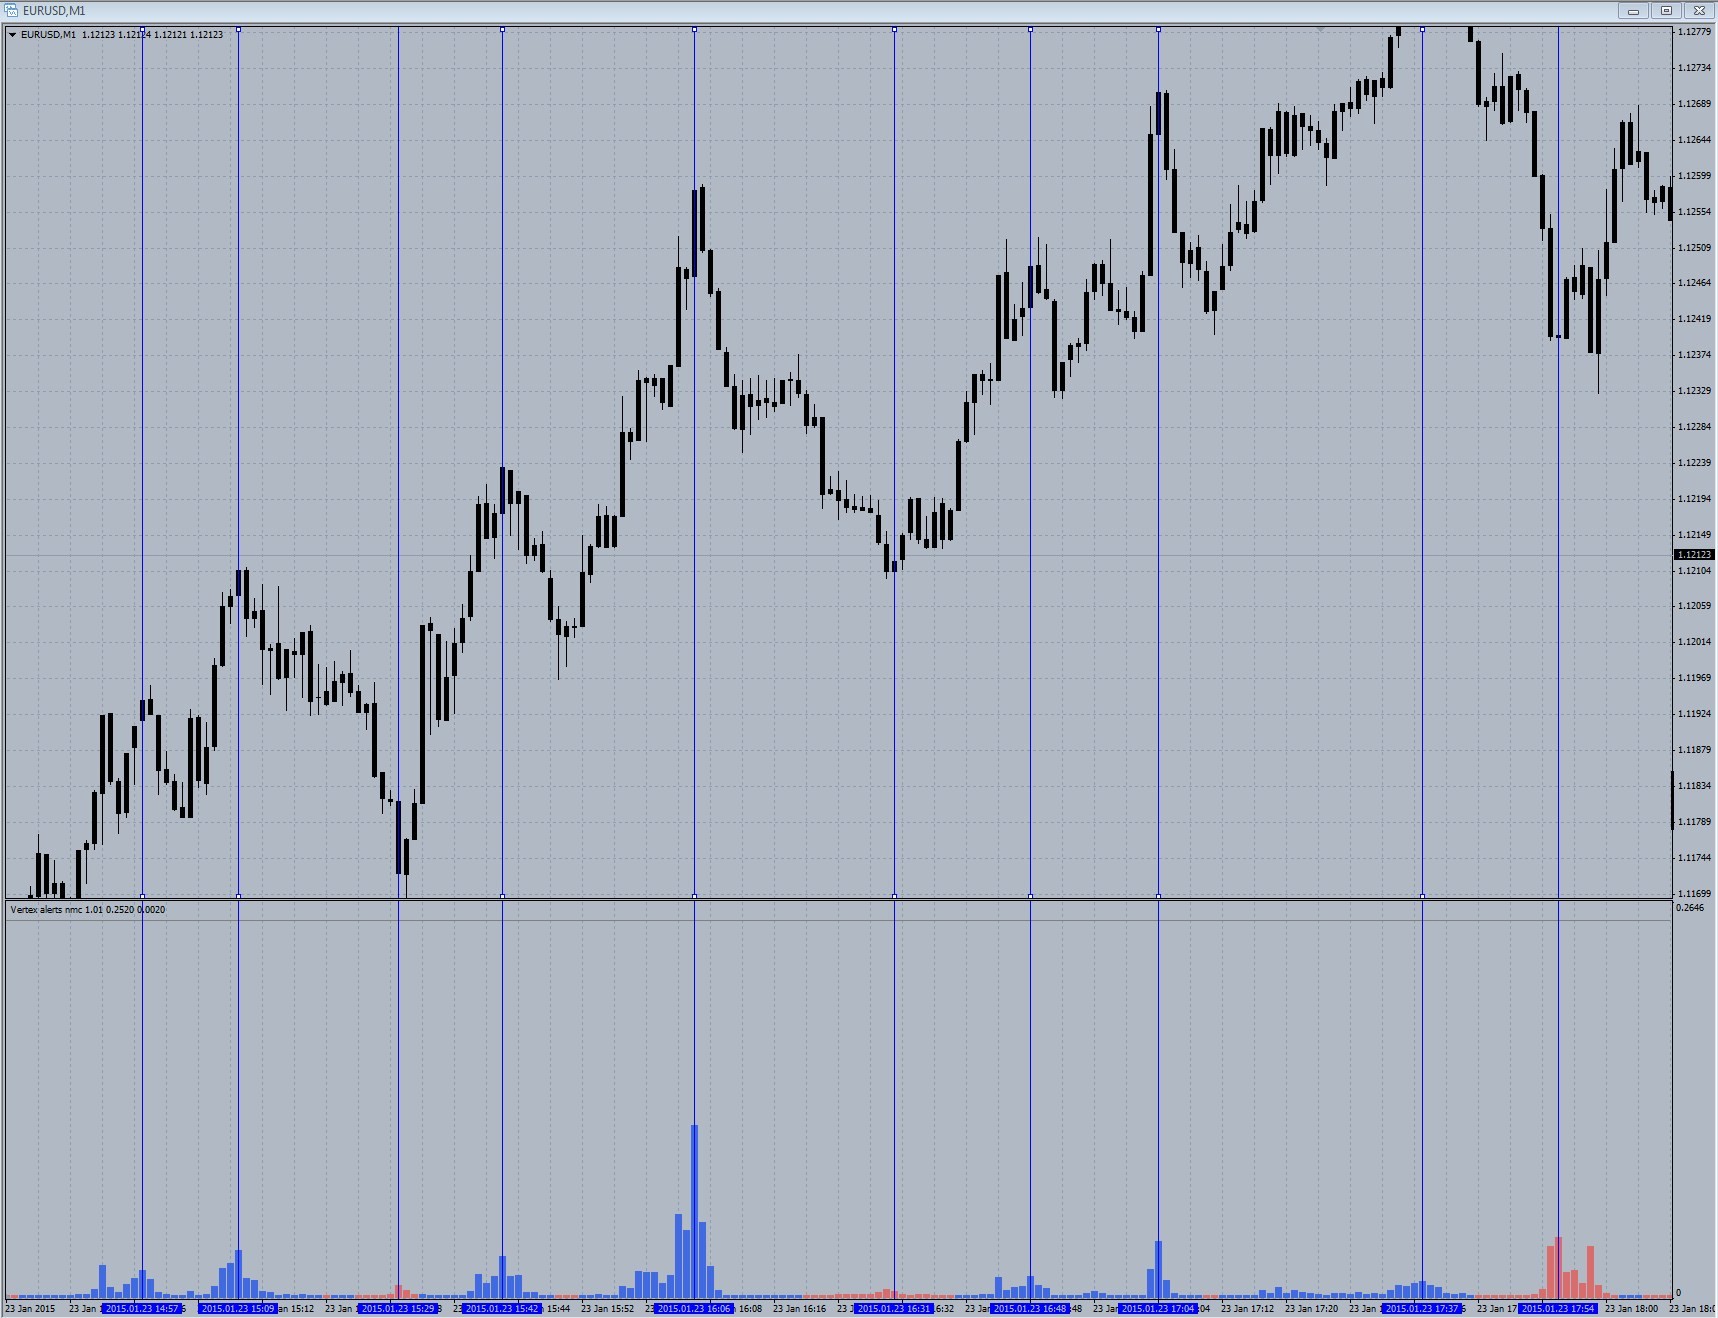
vertex_alerts_nmc_1.01.mq4