Float
My adobe crashes when I try to read this. Anyone else have a problem with it? Is it available in .doc form?
Thanks,
Thru
My adobe crashes when I try to read this. Anyone else have a problem with it? Is it available in .doc form?
Thanks,
ThruI downloaded it and opened with no problem (Acrobat Reader 4.0).
Forum on trading, automated trading systems and testing trading strategies
Sergey Golubev, 2005.12.12 09:25
Yes it is good indicator for me to understand where the price is.
Sometimes I am using Stoch (14, 5, 5), sometimes EMA (55), EMA (21) or EMA (8), or just all 3 EMAs together, the classical Parabolic SAR with default setting ... Just everything. And it is very good and I may confirm some my decision (about the market direction or reversal or something) by one indicator, and I may confirm this one indicator by an other indicator, and an other one by an other one and so on. There is good correlation between them.
But sometimes very strange cases happened:
Some people call this case as market correction. It happened sometimes: no correlation between indicators and everything is going on with the contradiction with each other.
And Float indicator helps me sometimes.
Forum on trading, automated trading systems and testing trading strategies
Sergey Golubev, 2013.12.04 07:08
How to Use Fibonacci (based on dailyfx.com article)
Talking Points
- Fibonacci retracement zones can be used to determine when a correction in trend is over.
- Traders use Fibonacci retracement zones to pinpoint low risk well defined trade opportunities
- Fibonacci lines can be used to place stops and limits.
Catching a Ride on the Trend
Many traders struggle to “make the trend their trend” because they lack a
consistent entry strategy for rejoining an established trend. It is
commonly held that a trend does not move in a straight line. Rather, a
trend expands and contracts much like the inhaling or exhaling of
breath. This rhythmical pattern can be predicted mathematically by many
Forex Traders based on set of Fibonacci ratios. This can help traders
find low risk entries for trading with the trend.
Leonardo Pisano Bigollo, also known Fibonacci was a 12th century Italian
mathematician who is credited for introducing the Golden mean to
Western civilization. He used a problem that asked how many pairs of
rabbits are created by one pair in one year to introduce the Fibonacci
series.
The series goes like this 1,2,3,5,8,13,21,34,55,89,144,233,377. The
first and second numbers are added to get the third number then the
third and fourth numbers are added to get the fifth number and so on. So
you are probably asking how do rabbits and number series give me a
place to enter USD/JPY?
Well, these numbers are related to give us the Fibonacci ratios that
traders use. Take the first number 1 and divide it by 2 to get 0.50.
Take 21 and divide it by 34 to get 0.618, another retracement level and
divide the alternating numbers like 13 and 34 to get 0.382 which is
another Fibonacci level.
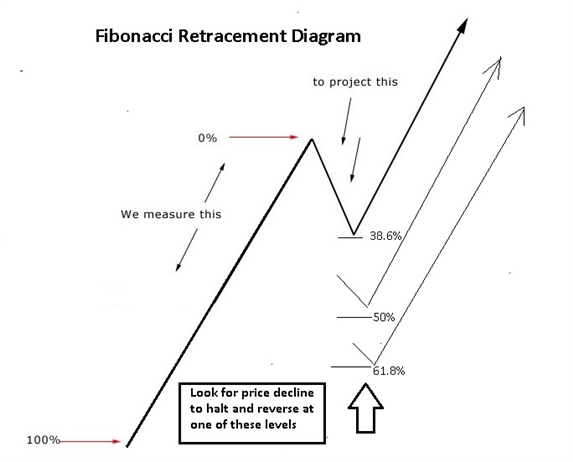
Applying these Ratios to a Trend
Like reproducing rabbits, a trend is a state of growth. So applying
these ratios to an established expanding trend often reveal great areas
to trade with the trend. These ratios act like signs on a street
revealing where the next bus stop is likely to turn up. Notice in the
diagram below how after a move higher, price is likely to pull back and
rebound from one of these areas.
Trading Setup
The current trading setup shows a USD/JPY 4-hour chart uptrend swing that started on November 26th at 101.13 and stoppedat 103.36 on December 2nd. Though some traders may have missed this 225 pip rise, they can still have a second chance at joining this trend using the retracement ratios. In the chart below, we can clearly see that USD/JPY did not stop at the 23.6% Fibonacci level at 102.84. So we look to the next Fibonacci level at 102.51 which is the 38.2%. USDJPY could rebound from that level and we would need to watch this level. But the wide ranging red bearish candle may push right through the 38% Fibonacci straight down to the 50% Fibonacci level at 102.25. USDJPY spent 48 hours consolidating at this level so I am looking for price to rebound from 102.25.
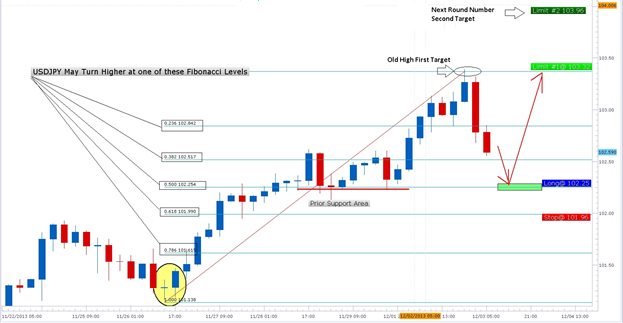
If this level holds, a stop can be placed below the 61.8% Fibonacci
level after entering long around 102.25. The first target would be the
old December 2nd high of 103.36. A breakout above that area could take
USDJPY to the 104.00 area. There two more Fibonacci levels however the
deeper the correction the less likely the trend is to continue.
Sometimes, price may turn just a few pips away from a Fibonacci level so
it is also important to look at Fibonacci as zones of support and
resistance rather than concrete levels.
In sum, traders have a great opportunity to rejoin a very strong USD/JPY uptrend using Fibonacci retracements
- Free trading apps
- Over 8,000 signals for copying
- Economic news for exploring financial markets
You agree to website policy and terms of use
Two pages from the book "Professional Stock Trading. System Design and Automation" by Mark R. Conway and Aaron N. Behle