Mandarine: discussion and improvements
hi Alex, Beluck, forexts, brunofx, quksilver
The name MandarineXL its great 
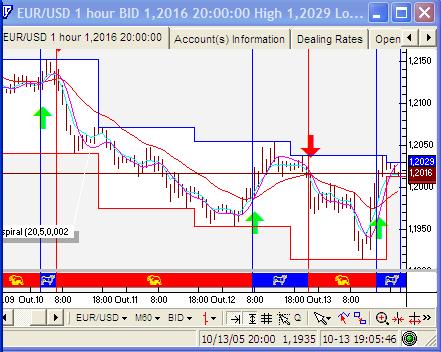
Could you put some arrows in the chart?
This EA only shorter?
In my VT Trader i've long at 10/12/2005 8:00 AM EST and today at 15:00 PM..
Why Mandarine doesnt go long?
thanks all
hellkkas
hello,
My first conclusions are : on this link
There is a bug in the T3MA indicator posted here.
It took a long time to
SetIndexStyle(0,DRAW_LINE);
SetIndexDrawBegin(0,Periods);
if(
!SetIndexBuffer(0,e7) &&
!SetIndexBuffer(1,e2) &&
!SetIndexBuffer(2,e3) &&
!SetIndexBuffer(3,e4) &&
!SetIndexBuffer(4,e5) &&
!SetIndexBuffer(4,e6) &&
!SetIndexBuffer(5,e1)
)
Print("cannot set indicator buffers!");
[/CODE]
Look---the same index buffer is set to e5[] and e6[]. That's wrong.
Change to
[CODE]
!SetIndexBuffer(4,e5) &&
!SetIndexBuffer(5,e6) &&
!SetIndexBuffer(6,e1)
This gives some very different results.
mbkennel thanks for a hint. indeed was my mistake. here is updated version.
Thanks.
I moved the updated indicator to the respective section of the downloads'area.
this metatrader is still buggy 
i had to code t3ma directly into expert to get buy signals on backtest.
here is updated expert
The same two indicators with SATL (default settings) - see picture.
If the t3 indicator is similar with satl so we may use an other digital indicators just to improve the system.
May be.
So, if t3 is similar with SATL it is the main trend. On the picture:
- T3M in aqua color;
- SATL is blue;
- FATL is white;
- on indicator window 1 is FTLM-STLM.
T3M is the main trend. If FTLM-STLM (STLM let's say) is zero so it is the reverse point (for T3M). If the FATL and SATL are going on the same direction it is the very strong trend.
Growing STLM and growing SATL in the same time is evidence of the bullish trend acceleration. Horizontal and positive STLM and growing SATL is evidence of the set bullish trend. The more absolute the value of STLM, the more potential the bullish trend has. Falling STLM at falling SATL testifies the bearish trend acceleration.
Besides if take into account the RBCI2 indicator we may use information on what area of the values (neutral, overbought, oversold, local maximum and local minimum) we want to put our order (and for S/L as well).
- Free trading apps
- Over 8,000 signals for copying
- Economic news for exploring financial markets
You agree to website policy and terms of use
and here is expert. try backtesting with default settings on EURUSD H1. not bad
Hello Beluck, can you post backtesting results?
I'm not getting good backtesting results, but perhaps I'm doing something bad.
Best regards.