Digital Filters (basic explanation)
Main difference of FTLM and STLM from classical technical instrument Momentum is that for its calculation not the close prices but smoothed (leveled) in the result of filtration values of the trend line are used. In the result FTLM and STLM turn out more leveled (smoothed) and regular functions than the classical instrument Momentum, and therefore have more forecasting value.
During computation the classical indicators Momentum requirement is often not fulfilled and it leads to unavoidable distortions in the spectrum of the entering signal. Specialists in the digital processing of the signals name these distortions aliasing that is frequencies overlay or ambiguity. This ambiguity leads to strong irregularity and chaos in the classical technical indicator Momentum.
Main Principles for the Trading Algorithm Development Using the Digital Filters:
- Trade only in the direction of the prevailing tendency the direction of which is specified by "slow" adaptive trend line SATL;
- To consider dynamic characteristics of the "fast" and "slow" trend represented by the FTLM and STLM indicators;
- To use information on what area of the values (neutral, overbought, oversold, local maximum and local minimum) is the sum of prevailing market cycles (index of RBCI) in chosen by means of frequency range spectral analysis;
- To take oscillator signals as secondary ones in cases when trend indicators are evidence of the very marked bearish or bullish tendency availability;
- To take oscillator signals as main ones in cases when trend indicators give signals about absence of the very marked tendency;
- To use flexible system of protective stop orders based on the values of RBCI, PCCI indexes and volatility values of the "fast" market oscillations.
Main rules for the above mentioned instruments interpretation are the following:
- Growing SATL line is evidence of the bullish trend on the market. The point of the reversal beginning of the bearish trend is considered the point of the local minimum of SATL. The point of finishing the reversal of the bearish trend is the point where the sign of STLM changed from minus into plus.
- Falling SATL line is evidence of the bearish trend on the market. The point of the bullish trend reversal beginning is considered the point of the local SATL maximum. The point of finishing the bullish trend reversal is the point where STLM sign changed from plus into minus.
- Close to horizontal the form of SATL is evidence of the neutral tendency.
- STLM interpretation requires special attention. Positive value of STLM is evidence of the bullish trend and the negative one testifies the bearish trend. STLM is an advance indicator. Local minimum of STLM always precedes the local minimum of SATL. Local maximum of STLM always precedes the local maximum of SATL. Achievement by STLM its points of extremum is necessary but insufficient condition for the achievement by the curve of SATL the top or the bottom. Growing STLM at growing SATL is evidence of the bullish trend acceleration. Horizontal and positive STLM at growing SATL is evidence of the set bullish trend. The more absolute the value of STLM, the more potential the bullish trend has. Falling STLM at falling SATL testifies the bearish trend acceleration.
Horizontal and negative STLM at growing SATL testifies the bearish trend setting. The more absolute value of STLM, the more potential the bearish trend has.
- Growing "fast" FATL trend line at the growing "slow" SATL trend line is evidence of the strong bullish trend on the market.
- Falling "fast" line of FATL at the falling "slow" line of SATL is evidence of the strong bearish trend on the market.
- Growing FATL line at falling SATL line is evidence of either bullish correction at the bearish trend or consolidation.
- Falling FATL line at growing SATL line is evidence of either bearish correction at the bullish trend or consolidation.
- The beginning or resuming the movement in one direction of FATL and SATL lines give signals either on the tendency reversal or finishing the correction and resuming price movement in the SATL direction.
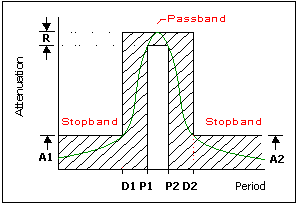
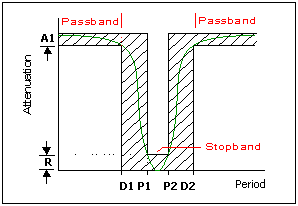
Calculation of band pass (indicator KGBP, RBCI) and band stop filters (indicator KGBS).
Three extra input values are needed for such filters (see pictures).
Additional parameters are used:
- Pass Band Cutoff frequency, P2.
- Stop Band frequency, D2
- Attenuation in Stop Band region, A2.
Other parameters are the same, as at the filters described above.
All the calculation you may do using the small software (see download area)
by one click to have the indivcator for MT3 or MT4.
Besides, you may create any combination of filters in one indicator.
And what is more, you can estimate all the parameters using the chart with your desirable pair and timeframe.
And more: you may compare the characteristics of several filters and you may see it on the charts.
Besides, you may use dll files to create any filter in MT4 even without any software.
- Free trading apps
- Over 8,000 signals for copying
- Economic news for exploring financial markets
You agree to website policy and terms of use
What is the filter?
In signal processing, the function of a filter is to remove unwanted parts of the signal, such as random noise, or to extract useful parts of the signal, such as the components lying within a certain frequency range.
Ok. Why digital?
A digital filter uses a digital processor to perform numerical calculations on sampled values of the signal. The processor may be a general-purpose computer such as a PC, or a specialized DSP (Digital Signal Processor) chip.
Too complicated. Do I know the filter?
Yes of course:
- Simple Moving Average (SMA) is a average value of a last sequence in series of data. It is an example DF with Finite Impulse Response FIR also known as non-recursive filters.
- Triangle and Weighted Moving Average are calculated as SMA but elements in the series have different weights. Triangle (TMA) has maximum weight in the middle. Weighted (WMA) has minimum weights in the middle.
- Exponential MA is calculated as: Y = Y + (X - Y) * Alpha Where X is input data. Y is output data. Alpha is a coefficient that defines the smoothness of the indicator line. This is an example of DF as IIR filter.
- Momentum, ROC, MACD, TRIX and others - digital filters as well.
So what we are talking about! We know those filters!
Most of indicators used in Technical Analysis (TA) are regular linear digital filters (DF). Practically all of them have inside themselves moving averages parts (which are low pass filters). We can say now that the DF is a part of any TA. DFs are well investigated. There are methods of calculating of DF by calculatios, by weights coefficients or by the impulse response.