Can anyone tell how to trade XAUUSD?
How to trade? Are you asking or what?
- Always use stop loss value for your trades
- never trade 100 or 20 or 50 lot size on demo (because you may not have such a big deposit with real money to trade with those big lot sizes)
- always understand why you open the trade
- analyse the losing trades. Remember - experienced trades are analysing the losing trades more than profitable ones. Why? because they want to understand - when they will lose and why.
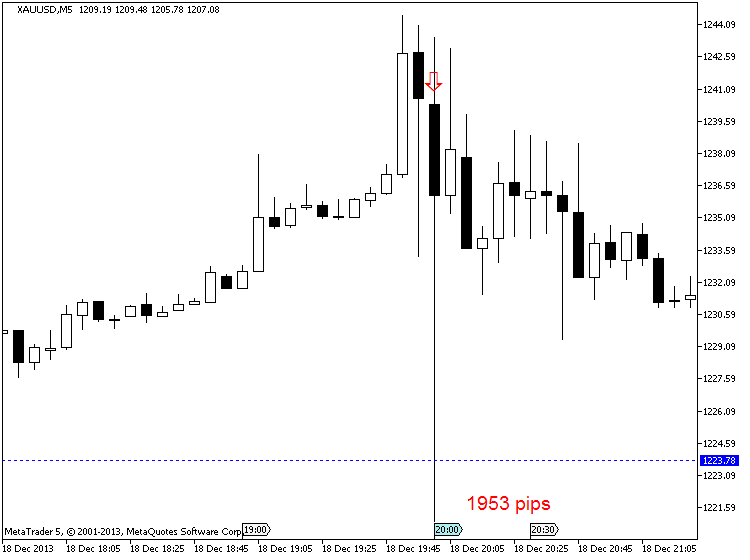
About pips for XAUUSD in your statement ... for example : 1239.59 - 1223.78 = 15.81 right? So, it is 1581 pips (because it is gold related to USD - if i am wrong so sorry). But what you provided by statement (91 pips ... 88 pips) ... are you making scalping using lot size = 50 or 100? :) :)
Just an example :
MetaTrader Trading Platform Screenshots
MetaQuotes Software Corp., MetaTrader 5, Demo
XAUUSD M5 : 1953 pips price movement by USD - Federal Funds Rate news event
Can anyone tell how to trade GOLD ?
Forum on trading, automated trading systems and testing trading strategies
Something Interesting in Forex Video May 2013
newdigital, 2013.05.11 07:32
This is 40 minute webinar about the following: Gold, Crude, Russell with price action trading. John Paul explained how to use price action when trading news events.
Forum on trading, automated trading systems and testing trading strategies
newdigital, 2013.07.01 21:04
How can we know: correction, or bullish etc (in case of using indicator for example)?
well ... let's take AbsoluteStrength indicator from MT5 CodeBase.
bullish (Bull market) :
bearish (Bear market) :
ranging (choppy market - means: buy and sell on the same time) :
flat (sideways market - means: no buy and no sell) :
correction :
correction in a bear market (Bear Market Rally) :
Forum on trading, automated trading systems and testing trading strategies
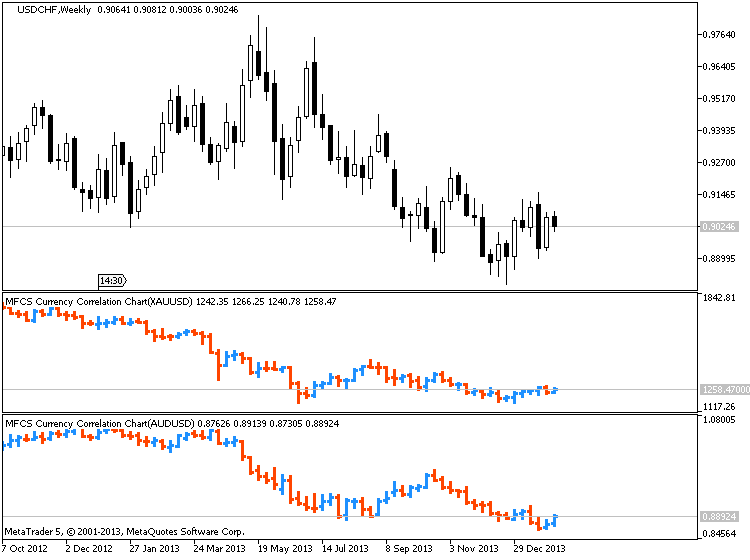
Indicators: MFCS Currency Correlation Chart
newdigital, 2014.02.04 08:27
Trade Gold Using Currency Correlations (based on dailyfx article)
Talking Points:
- Correlations are useful to find direction for a variety of markets.
- Gold and the AUDUSD have a positive correlation.
- Once direction is found, plan your trading strategy for another asset.
Let’s get started!
Golds Correlation
When someone mentions Gold, the AUDUSD should immediately come to mind as a correlating asset. These assets are positively correlated, meaning they can be seen generally moving in the same direction. First this correlation works because both assets are priced in US Dollars. The AUD/USD pair represents Aussie Dollars priced in US Dollars. While gold is XAU/USD or gold priced in US Dollars per oz. When the US dollar gains strength, both assets tend to depreciate in value.
Secondly, the AUD has a high correlation to gold due to Australia’s
extensive gold mining operations. As gold prices fluctuate, this
increases or decreases the amount of funds transferred into AUD to make
purchases of the metal. These transfers essentially change demand for
the currency and can directly cause changes in the AUDUSD currency pair
as well.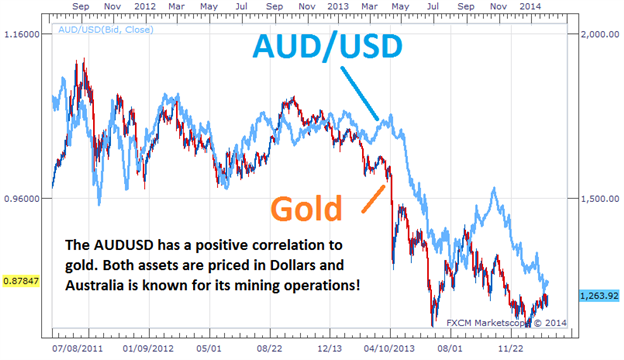
Trading the Correlation
The key to trading positively correlated assets, is finding a direction from one of the underlying assets before making a trading decision. If traders are seeing the AUDUSD push to lower lows, this could easily be the catalyst for a bearish bias on Gold. Conversely if gold is trending upwards, this can also be a signal of a new uptrend on the AUDUSD.
As you can see, this information is very useful to traders that have a
general fundamental view of the market. If you have an opinion on Gold
or the US Dollar this can be relayed into a trade idea. Often traders
that are bullish on Gold choose to trade the AUDUSD instead of the metal
itself. The Aussie Dollar carries a 2.50% banking rate, meaning traders
can earn additional interest while executing a buy order on a
positively correlated opinion of Gold. If a trader is bearish on the
AUDUSD currency pair, traders can in turn sell gold to avoid
accumulating interest on their trading balance.
Forum on trading, automated trading systems and testing trading strategies
Something Interesting in Financial Video July 2013
newdigital, 2013.07.13 19:50
Trading the Gold Silver Ratio :
For the hard-asset enthusiast, the gold-silver ratio is part of common parlance, but for the average investor, this arcane metric
is anything but well-known. This is unfortunate because there's great
profit potential using a number of well-established strategies that rely
on this ratio.
In a nutshell, the gold-silver ratio represents the number of silver ounces it takes to buy a single ounce of gold. It sounds simple, but this ratio is more useful than you might think. Read on to find out how you can benefit from this ratio.
How the Ratio Works
When gold trades at $500 per ounce and silver at $5, traders refer to a gold-silver ratio of 100. Today the ratio floats, as gold and silver are valued daily by market forces, but this wasn't always the case. The ratio has been permanently set at different times in history - and in different places - by governments seeking monetary stability.
Here's a thumbnail overview of that history:
- 2007 – For the year, the gold-silver ratio averaged 51.
- 1991 – When silver hit its lows, the ratio peaked at 100.
- 1980 – At the time of the last great surge in gold and silver, the ratio stood at 17.
- End of 19th Century – The nearly universal, fixed ratio of 15 came to a close with the end of the bi-metallism era.
- Roman Empire – The ratio was set at 12.
- 323 B.C. – The ratio stood at 12.5 upon the death of Alexander the Great.
How to Trade the Gold-Silver Ratio
First off, trading the gold-silver ratio is an activity primarily undertaken by hard-asset enthusiasts like "gold bugs". Why? Because the trade is predicated on accumulating greater quantities of the metal and not on increasing dollar-value profits. Sound confusing? Let's look at an example.
The
essence of trading the gold-silver ratio is to switch holdings when the
ratio swings to historically determined "extremes." So, as an example:
- When a trader possesses one ounce of gold, and the ratio rises to an unprecedented 100, the trader would then sell his or her single gold ounce for 100 ounces of silver.
- When the ratio then contracted to an opposite historical "extreme" of, say, 50, the trader would then sell his or her 100 ounces for two ounces of gold.
- In this manner, the trader would continue to accumulate greater and greater quantities of metal, seeking "extreme" ratio numbers from which to trade and maximize his or her holdings.
For those worried about devaluation, deflation,
currency replacement - and even war - the strategy makes sense.
Precious metals have a proven record of maintaining their value in the
face of any contingency that might threaten the worth of a nation's fiat currency.
Drawbacks of the Trade
The obvious difficulty with the trade is correctly identifying those "extreme" relative valuations between the metals. If the ratio hits 100 and you sell your gold for silver, then the ratio continues to expand, hovering for the next five years between 120 and 150, you're stuck. A new trading precedent has apparently been set, and to trade back into gold during that period would mean a contraction in your metal holdings.
What is there to do in that case? One could always continue to add to one's silver holdings and wait for a contraction in the ratio, but nothing is certain. This is the essential risk to those trading the ratio. It also points out the need to successfully monitor ratio changes over the short and medium term in order to catch the more likely "extremes" as they emerge.
Conclusion
There's an entire world of investing permutations available to the gold-silver ratio trader. What's most important is to know one's own trading personality and risk profile. For the hard-asset investor concerned with the ongoing value of his or her nation's fiat currency, the gold-silver ratio trade offers the security of knowing, at the very least, that he or she always possesses the metal.
| 04.09.2014 17:15 | 04.10.2014 08:16 | XAGUSD | Buy | 1.00 | - | 30.00 | 19.78000 | 20.08000 | 30.0 | 1484.00 | 15h 1m | 0.66% | |||
| 04.09.2014 17:15 | 04.10.2014 08:16 | XAGUSD | Buy | 1.00 | - | 30.00 | 19.78000 | 20.08000 | 30.0 | 1484.00 | 15h 1m | 0.67% | |||
| 04.09.2014 17:15 | 04.10.2014 08:16 | XAGUSD | Buy | 1.00 | - | 30.00 | 19.78000 | 20.08000 | 30.0 | 1484.00 | 15h 1m | 0.67% | |||
| 04.09.2014 17:15 | 04.10.2014 08:16 | XAGUSD | Buy | 1.00 | - | 30.00 | 19.78000 | 20.08000 | 30.0 | 1484.00 | 15h 1m | 0.68% | |||
| 04.04.2014 14:37 | 04.09.2014 12:34 | XAGUSD | Sell | 12.00 | - | 34.00 | 20.09000 | 19.75000 | 34.0 | 20316.00 | 4d | 10.20% | |||
| 04.04.2014 14:37 | 04.09.2014 12:34 | XAGUSD | Sell | 12.00 | - | 34.00 | 20.09000 | 19.75000 | 34.0 | 20316.00 | 4d | 11.35% | |||
| 04.04.2014 14:37 | 04.09.2014 12:34 | XAGUSD | Sell | 12.00 | - | 34.00 | 20.09000 | 19.75000 | 34.0 | 20316.00 | 4d | 12.81% | |||
| 04.04.2014 14:37 | 04.09.2014 12:34 | XAGUSD | Sell | 12.00 | - | 34.00 | 20.09000 | 19.75000 | 34.0 | 20316.00 | 4d | 14.69% | |||
| 04.04.2014 14:37 | 04.09.2014 12:34 | XAGUSD | Sell | 12.00 | - | 34.00 | 20.09000 | 19.75000 | 34.0 | 20316.00 | 4d | 17.22% | |||
| 04.04.2014 14:37 | 04.04.2014 14:39 | XAGUSD | Sell | 12.00 | - | 34.00 | 20.09000 | 20.06000 | 3.0 | 1752.00 | 2m | 1.51% | |||
| 04.03.2014 14:34 | 04.04.2014 13:54 | XAGUSD | Buy | 7.00 | - | 34.00 | 19.84000 | 20.18000 | 34.0 | 11844.00 | 23h 20m | 11.34% |
you would try a divergence


123 pattern work for me on xauusd with small stoploss, spot point 2, wait for pullback entering trade at point 3 (hypotetical) then ride the rocket :))
- Free trading apps
- Over 8,000 signals for copying
- Economic news for exploring financial markets
You agree to website policy and terms of use
Can anyone tell how to trade ?