for(int a=1;a<tfnumber+1;a++)
   ObjectDelete("Ind"+a);
for(int j=1;j<tfnumber+1;j++){
   ObjectCreate("Ind"+j,OBJ_LABEL,0,0,0,0,0);
for(int x=1;x<tfnumber+1;x++){
   FastSMA=iMA("GBPUSD.c",tframe[x-1],FastSMAofC_Period,0,FastSMAofC_Mode,FastSMAofC_PriceMode,0);
   :
for(int y=1;y<tfnumber+1;y++){
   if(IndVal[y-1]==-1) ObjectSetText("Ind"+y,CharToStr(238),12,"Wingdings",MidDownColor)
   :
You create objects with a prefix and TF index and get values for one (hard coded) pair. Where is your outer loop over all pairs, and adjust the object names for pair and TF?
You create objects with a prefix and TF index and get values for one (hard coded) pair. Where is your outer loop over all pairs, and adjust the object names for pair and TF?
I have completely reworked the code:
#property copyright "Ghost Wolf"
#property link      "Stormwind"


#property indicator_chart_window


//+------------------------------------------------------------------------------------------------------------------+
// YOU CAN CHANGE THESE PARAMETERS ACCORDING TO YOUR TASTE:
//+------------------------------------------------------------------------------------------------------------------+
int     tfnumber      = 9; // Number of the timeframes
int     tframe[]      = {1,5,15,30,60,240,1440,10080,43200}; // Timeframes in minutes
string tf[]={"MN1","W1","D1","H4","H1","M30","M15","M5","M1"};
double  IndVal[][9]; // Be the second array-index equal with tfnumber
int     NumberOfPairs = 7; // Number of the pairs
string  Pairs[]       = {"GBPUSD.c","EURUSD.c","AUDUSD.c","NZDUSD.c","USDCHF.c","USDCAD.c","USDJPY.c"}; // Requested pairs

extern string IndicatorSettings=">>> Moving Average settings:<<<";
extern int FastSMAofC_Mode = 0; //0=sma
extern int FastSMAofC_Period = 5; //sma period
extern int FastSMAofC_PriceMode = 0; //0=close,1=open,2=high,3=low
extern int SlowSMAofC_Mode = 0; //0=sma
extern int SlowSMAofC_Period = 10; //sma period
extern int SlowSMAofC_PriceMode = 0; //0=close,1=open,2=high,3=low
extern int TwentySMAofH_Mode = 0; //0=sma
extern int TwentySMAofH_Period = 20; //sma period
extern int TwentySMAofH_PriceMode = 2; //0=close,1=open,2=high,3=low
extern int TwentySMAofL_Mode = 0; //0=sma
extern int TwentySMAofL_Period = 20; //sma period
extern int TwentySMAofL_PriceMode = 3; //0=close,1=open,2=high,3=low

//+------------------------------------------------------------------------------------------------------------------+
//+------------------------------------------------------------------------------------------------------------------+


extern color      UpColor                     = Green;
extern color      DownColor                   = Red;
extern color      FlatColor                   = Yellow;
extern color      FontColor                   = White;
extern color      MidDownColor                = Orange;
extern color      MidUpColor                  = LightGreen;
extern int        PosX                        = 1320;
extern int        PosY                        = 100;


double SlowSMA,FastSMA,TwentySMAofH,TwentySMAofL;

//+------------------------------------------------------------------+
//| Custom indicator initialization function                         |
//+------------------------------------------------------------------+
int init()
  {
//----
   for(int w=0;w<NumberOfPairs;w++)
      {
      for(int j=0;j<tfnumber;j++)
      {
         ObjectCreate("BigTrendInd"+w+j,OBJ_LABEL,0,0,0,0,0);
         ObjectSet("BigTrendInd"+w+j,OBJPROP_CORNER,0);
         ObjectSet("BigTrendInd"+w+j,OBJPROP_XDISTANCE,j*23+PosX+50);
         ObjectSet("BigTrendInd"+w+j,OBJPROP_YDISTANCE,w*23+PosY+10);
         ObjectSetText("BigTrendInd"+w+j,CharToStr(110),12,"Wingdings",Silver);
      }
      }

   for(w=0;w<NumberOfPairs;w++)
      {
         ObjectCreate("BigTrendPairs"+w,OBJ_LABEL,0,0,0,0,0);
         ObjectSet("BigTrendPairs"+w,OBJPROP_CORNER,0);
         ObjectSet("BigTrendPairs"+w,OBJPROP_XDISTANCE,PosX);
         ObjectSet("BigTrendPairs"+w,OBJPROP_YDISTANCE,w*23+PosY+11);
         ObjectSetText("BigTrendPairs"+w,Pairs[w],8,"Tahoma",FontColor);
      }
   for(int q=1;q<tfnumber+1;q++)
      {
         ObjectCreate(tf[q-1],OBJ_LABEL,0,0,0,0,0);
         ObjectSet(tf[q-1],OBJPROP_CORNER,1);
         ObjectSet(tf[q-1],OBJPROP_XDISTANCE,(q-1)*23+62);
         ObjectSet(tf[q-1],OBJPROP_YDISTANCE,90);
         ObjectSetText(tf[q-1],tf[q-1],8,"Tahoma",White);
      }

   ObjectCreate("BigTrendLine0",OBJ_LABEL,0,0,0,0,0);
   ObjectSet("BigTrendLine0",OBJPROP_CORNER,0);
   ObjectSet("BigTrendLine0",OBJPROP_XDISTANCE,PosX+83);
   ObjectSet("BigTrendLine0",OBJPROP_YDISTANCE,NumberOfPairs*16+PosY-150);
   ObjectSetText("BigTrendLine0","   ----------------------",8,"Tahoma",FontColor);

   ObjectCreate("BigTrendLine1",OBJ_LABEL,0,0,0,0,0);
   ObjectSet("BigTrendLine1",OBJPROP_CORNER,0);
   ObjectSet("BigTrendLine1",OBJPROP_XDISTANCE,PosX+83);
   ObjectSet("BigTrendLine1",OBJPROP_YDISTANCE,NumberOfPairs*16+PosY-155);
   ObjectSetText("BigTrendLine1","   ----------------------",8,"Tahoma",FontColor);

   ObjectCreate("BigTrendIndName",OBJ_LABEL,0,0,0,0,0);
   ObjectSet("BigTrendIndName",OBJPROP_CORNER,0);
   ObjectSet("BigTrendIndName",OBJPROP_XDISTANCE,PosX+113);
   ObjectSet("BigTrendIndName",OBJPROP_YDISTANCE,NumberOfPairs*16+PosY-165);
   ObjectSetText("BigTrendIndName","MA Trend",8,"Tahoma",FontColor);


   ArrayResize(IndVal,NumberOfPairs);
//----
   return(0);
  }
//+------------------------------------------------------------------+
//| Custom indicator deinitialization function                       |
//+------------------------------------------------------------------+
int deinit()
  {
//----
   for(int w=0;w<NumberOfPairs;w++)
      {
      for(int j=0;j<tfnumber;j++)
      {
      ObjectDelete("BigTrendInd"+w+j);
      }
      }

   for(w=0;w<NumberOfPairs;w++)
      {
         ObjectDelete("BigTrendPairs"+w);
      }

   ObjectDelete("BigTrendLine0");
   ObjectDelete("BigTrendLine1");
   ObjectDelete("BigTrendIndName");

//----
   return(0);
  }
//+------------------------------------------------------------------+
//| Custom indicator iteration function                              |
//+------------------------------------------------------------------+
int start()
  {

   for(int z=0;z<NumberOfPairs;z++)
      {
   for(int x=0;x<tfnumber;x++)
      {


      SlowSMA=iMA(Pairs[z],tframe[x],SlowSMAofC_Period,0,SlowSMAofC_Mode,SlowSMAofC_PriceMode,0);
      FastSMA=iMA(Pairs[z],tframe[x],FastSMAofC_Period,0,FastSMAofC_Mode,FastSMAofC_PriceMode,0);
      TwentySMAofH=iMA(Pairs[z],tframe[x],TwentySMAofH_Period,0,TwentySMAofH_Mode,TwentySMAofH_PriceMode,0);
      TwentySMAofL=iMA(Pairs[z],tframe[x],TwentySMAofL_Period,0,TwentySMAofL_Mode,TwentySMAofL_PriceMode,0);


        if (SlowSMA < FastSMA && FastSMA > TwentySMAofH)   // STRONG UPTREND
        {
        IndVal[z][x]=2;
        }
        else if (SlowSMA > FastSMA && FastSMA > TwentySMAofH)   // UPTREND
        {
        IndVal[z][x]=1;
        }
        else if (FastSMA > TwentySMAofL && FastSMA < TwentySMAofH)   // RANGING
        {
        IndVal[z][x]=0;
        }
        else if (FastSMA > SlowSMA && FastSMA < TwentySMAofL)   // DOWNTREND
        {
        IndVal[z][x]=-1;
        }
        else if (FastSMA < SlowSMA && FastSMA < TwentySMAofL)   // STRONG DOWNTREND
        {
        IndVal[z][x]=-2;
        }


      }
      }


   for(int q=0;q<NumberOfPairs;q++)
      {
      for(int y=0;y<tfnumber;y++)
      {
         if(IndVal[q][y]==-2) ObjectSetText("BigTrendInd"+q+y,CharToStr(234),12,"Wingdings",DownColor);
         if(IndVal[q][y]==-1) ObjectSetText("BigTrendInd"+q+y,CharToStr(238),12,"Wingdings",MidDownColor);
         if(IndVal[q][y]==0) ObjectSetText("BigTrendInd"+q+y,CharToStr(232),12,"Wingdings",FlatColor);
         if(IndVal[q][y]==1) ObjectSetText("BigTrendInd"+q+y,CharToStr(236),12,"Wingdings",MidUpColor);
         if(IndVal[q][y]==2) ObjectSetText("BigTrendInd"+q+y,CharToStr(233),12,"Wingdings",UpColor);
      }
      }


//----
   return(0);
  }
//+------------------------------------------------------------------+
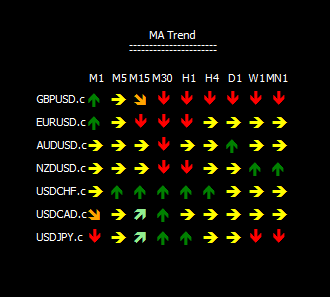
So it looks like this right now:

My current goal is to create a logic evaluating the arrows. Creating a column on the right side of the monthly arrows showing overall trend strength in %. Assign each arrow a value, lets say, an arrow upward is 1, flat arrow is 0,5, downward arrow is 0. The other two arrows are inbetween so the one poiting slightly upwards is 0,75 and the one downwards is 0,25. Now I would like the logic to take all 9 arrows from the pair into consideration, for example looking at the GBPUSD.c pair it would go like (1+0,5+0,25+0+0+0+0+0+0)/9=0,1944=19,44% which would translate into a strong downtrend considering: 100%-80% strong uptrend
79,99-60% uptrend 59,99-40% range 39,99-20% downtrend 19,99-0% strong downtrend. The problem for me right now is creating this logic. What should my first steps be?
- Free trading apps
- Over 8,000 signals for copying
- Economic news for exploring financial markets
You agree to website policy and terms of use
Hello, fellow coders!
I have been working on my Multi - pair trend indicator and so far the code looks like this:
Which translates into this on a chart:
Now I am trying to get the other values for other pairs to show but never seem to get it to work. If I add another pair the first one just gets deleted and so far I just fail to find out what may be causing this.
Any help is highly appreciated!
Best regards,
ruth