how to use Super Bollinger Band in EA
Please use the link button to post URLs
or Control-L
(see the difference?) https://www.mql5.com/en/market/product/8513# - "not get any results" is meaningless - just like saying the car doesn't work. Doesn't start, won't go in gear, no electrical, missing the key, flat tires - meaningless. There are no mind readers here.
- Did you buy it? Did you put it on a chart and look at the data window? Detailed explanation of iCustom - MQL4 forum
Please use the link button to post URLs
or Control-L(see the difference?) https://www.mql5.com/en/market/product/8513# - "not get any results" is meaningless - just like saying the car doesn't work. Doesn't start, won't go in gear, no electrical, missing the key, flat tires - meaningless. There are no mind readers here.
- Did you buy it? Did you put it on a chart and look at the data window? Detailed explanation of iCustom - MQL4 forum
Hello WHRoeder,
thanks for warning I will use the links anymore.
I bought it and put on a chart it is working. I added a screen shot as attachment.

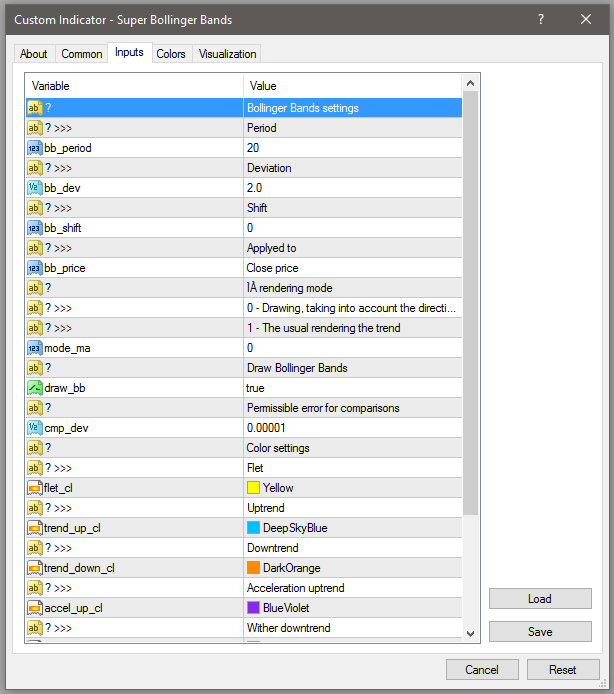
My explanation was inadequate, sorry for that. as you can see at the attachment there are 3 lines and I want to get timing when some specific color happened at the middle one. I looked for the indicator parameters and they are like this:
"
- bb_period - ribbons period (20)
- bb_dev - ribbons deviation (2)
- bb_shift - shift (0)
- bb_price - apply calculation to (Close Price)
- mode_ma - moving average drawing mode. 0 - full drawing regarding a trend direction and a direction of ribbons movement. 1 - regular drawing regarding a trend direction (0)
- draw_bb - show/hide ribbons. true - show ribbons. false - hide ribbons. (true)
- cmp_dev - acceptable error to compare characteristics in the process of drawing (0.0001)
- flet_cl - color to display flat (Yellow)
- trend_up_cl - color to display downward direction (DeepSkyBlue)
- trend_down_cl - color to display upward direction (DarkOrange)
- accel_up_cl - color to display ascending trend boosting (BlueViolet)
- fad_up_cl - color to display fading ascending trend (SaddleBrown)
- accel_down_cl - color to display descending trend boosting (Magenta)
- fad_down_cl - color to display fading descending trend (FireBrick)
- width_lines - lines width (2)
"
so I tried to use iCustom like th:
double xx = iCustom(NULL, PERIOD_CURRENT, "Super Bollinger Bands",20,2.0,0,"Close Price",1,true,0.00001,"Yellow","DeepSkyBlue","DarkOrange","DarkBlue","SaddleBrown","Red","FireBrick",2,0, 0);
or
double xx = iCustom(NULL, PERIOD_CURRENT, "Super Bollinger Bands",20,2.0,0,PRICE_CLOSE,0,true,0.00001,clrYellow,clrDeepSkyBlue,clrDarkOrange,clrDarkBlue,clrSaddleBrown,clrRed,clrFireBrick,2,0,1);
but result is always zero. I am also confused about lines. there are 3 of them. what would iCustom return to me ? I want the values of middle one (actually color of the middle one) but what if I want top line values. I couldn't understand the logic, as I said I am very new at mql4.
by the way, I bought it but there is no source (I guess this is the way it is) just ex4 file. so How can I achieve this?
thank you very much.
Hello again,
I understood the concept a little bit more. 3 lines at the indicator means, 3 array (IndexBuffer) and iCustom function reads these arrays and returns their values. using it's last 2th parameter iCustom decides which array (line at chart) will be read right ?
so as I want to read middle line, my Code should be like this:
double xx = iCustom(NULL, PERIOD_CURRENT, "Super Bollinger Bands",20,2.0,0,PRICE_CLOSE,0,true,0.00001,clrYellow,clrDeepSkyBlue,clrDarkOrange,clrDarkBlue,clrSaddleBrown,clrRed,clrFireBrick,2,1,0);
but it is still return zero.
Firstly, I don't know this indicator and I only downloaded the "free" Testing version to see what it is about.
Secondly, there are much more "properties" or "inputs" than those that you have referred to, that will need to be referenced in the "iCustom()" call, even if they are of no real use:
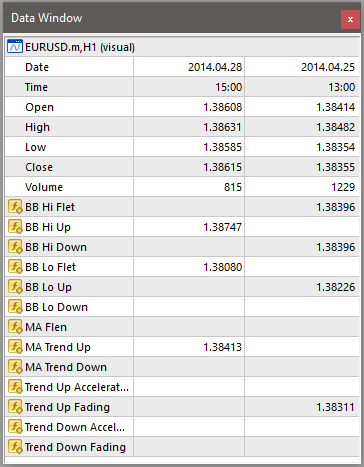
Thirdly, you seem to be only using "mode = 0" but the indicator has many other modes as can be seen in the "Data Window" (such as 0:"BB Hi Flet", 1:"BB Hi Up", 2:"BB Hi Down", etc.).
And lastly, if this all seems to be too complicated for you, then you are not ready to make your own EA. You will have to dig into the online documentation and examples in the Code Base, doing more research and experimentation. Alternatively, hire a coder in the Freelance section to code an EA for you.
Firstly, I don't know this indicator and I only downloaded the "free" Testing version to see what it is about.
Secondly, there are much more "properties" or "inputs" than those that you have referred to, that will need to be referenced in the "iCustom()" call, even if they are of no real use:
Thirdly, you seem to be only using "mode = 0" but the indicator has many other modes as can be seen in the "Data Window" (such as 0:"BB Hi Flet", 1:"BB Hi Up", 2:"BB Hi Down", etc.).
And lastly, if this all seems to be too complicated for you, then you are not ready to make your own EA. You will have to dig into the online documentation and examples in the Code Base, doing more research and experimentation. Alternatively, hire a coder in the Freelance section to code an EA for you.
Hi Fernando,
Thanks for reply, so I must send data for everything at "input" tab. some of them seems like captions. these are not complicated just I am new and learning these. This is my first day reading about indicators. I do not want to hire a coder. I can do it just need to learn as you said.
So, I added the other parameters to iCustom:
    double xx = iCustom(NULL, PERIOD_CURRENT, "Super Bollinger Bands","","",20,"deviation",2.0,
                                                                      "shift",0, "Applied to",PRICE_CLOSE,"","","",0,"",true,"",0.00001,"","",
                                                                      clrYellow,"",clrDeepSkyBlue,"",clrDarkOrange,"",clrDarkBlue,"",clrSaddleBrown,
                                                                      "",clrRed,"",clrFireBrick,"",2,1,0);
and it worked :) but still have a small problem, this gives the top line at the indicator. when I changed last 2th parameters "1,0);" to "2,0);" or "0,0);" result is zero. should I try other numbers too ?
edit: I tried them and found 7th is the middle line but as you can see at the chart, lines has specific colors. How can I get these colors ?
Do one of the following:
- Contact the creator/developer of the indicator and obtain instructions.
- Use the Buffer/Mode labels ("BB Hi Flet", "BB Hi Up", "BB Hi Down", etc.) as an indication of their function.
- Experiment with the Indicator and look at the Data Window at various bars to find out by trial and error.
Hello Fernando,
thank you very much. I also did not know about data window. so are these labels like "BB Hi Flet", "BB Hi Up", "BB Hi Down", etc. also defined arrays in the indicator ? for ex: 12th one is "Trend Down Acceleration", so if I use this:
     xx = iCustom(NULL, PERIOD_CURRENT, "Super Bollinger Bands","","",20,"deviation",2.0,
                                                                      "shift",0, "Applied to",PRICE_CLOSE,"","","",0,"",true,"",0.00001,"","",
                                                                      clrYellow,"",clrDeepSkyBlue,"",clrDarkOrange,"",clrDarkBlue,"",clrSaddleBrown,
                                                                      "",clrRed,"",clrFireBrick,"",2,12,0);
I will get "Trend Down Acceleration" value but if that time range, trend is not down acceleration, then it's value will be NULL as I understand. is that correct ?
- Then you didn't read my post and the link provided.
- NULL is a string or pointer, not a double. The buffer will be empty. The default is EMPTY_VALUE (2147483647,) but can be changed by SetIndexEmptyValue to any other value (usually zero.)
- Then you didn't read my post and the link provided.
- NULL is a string or pointer, not a double. The buffer will be empty. The default is EMPTY_VALUE (2147483647,) but can be changed by SetIndexEmptyValue to any other value (usually zero.)
Hello WHRoeder,
you are right, I just type it fast, NULL is not the correct but you understand what I mean. return value will be empty and it is usually zero.
by the way, I read your post and it was so helpful for me. I am sorry not mentioning about it. After your post I write a meaningless indicator and test via it. thanks for that.
- Free trading apps
- Over 8,000 signals for copying
- Economic news for exploring financial markets
You agree to website policy and terms of use
Hello,
I am quite new here. I want to know how to use "super bollinger band" (https://www.mql5.com/en/market/product/8513#) on EA. this indicator shows up and down acceleration points. I tried to use iCustom but could not get any results. Also this indicator shows up and down points using by colors, how can I get this info using iCustom. I couldn't figure it out.
thanks.