Trendlines
It's going to be tricky to program the way the human eye draws trendlines, but one technique that might help you is the following. Identify the price extremes (separating highs and lows) and draw a linear regression line across them. Example:
You can also try this for a support trendline: (this is what I did)
- Get the lows in an array
- Split the array in half so you have the older and the more recent lows separated
- Use a minimum search loop for each low-pair to (a) get the smallest positive angle (b) check if the trendline defined by the angle is not violated by the rest of the lows
- If you have a solution = Win. If you haven't there is probably no trend at all.
BTW I am not sure if an indicator would be the best solution for you. I'd rather use a script that draws trendlines on your chart. (See OBJ_TREND in help.)
Documentation on MQL5: Standard Constants, Enumerations and Structures / Objects Constants / Object Types
- www.mql5.com
Standard Constants, Enumerations and Structures / Objects Constants / Object Types - Documentation on MQL5
Trendlines aren't suppose to be drawn on main chart ?
angevoyageur:
Trendlines aren't suppose to be drawn on main chart ?
In a free market you can draw them wherever you want. My suggestion could be done on the main chart too, but I don't have examples of it.
Trendlines aren't suppose to be drawn on main chart ?
Thank you very much guys. I really appreciate your response.
which indicator most using in trading system
price is most used
You are missing trading opportunities:
- Free trading apps
- Over 8,000 signals for copying
- Economic news for exploring financial markets
Registration
Log in
You agree to website policy and terms of use
If you do not have an account, please register
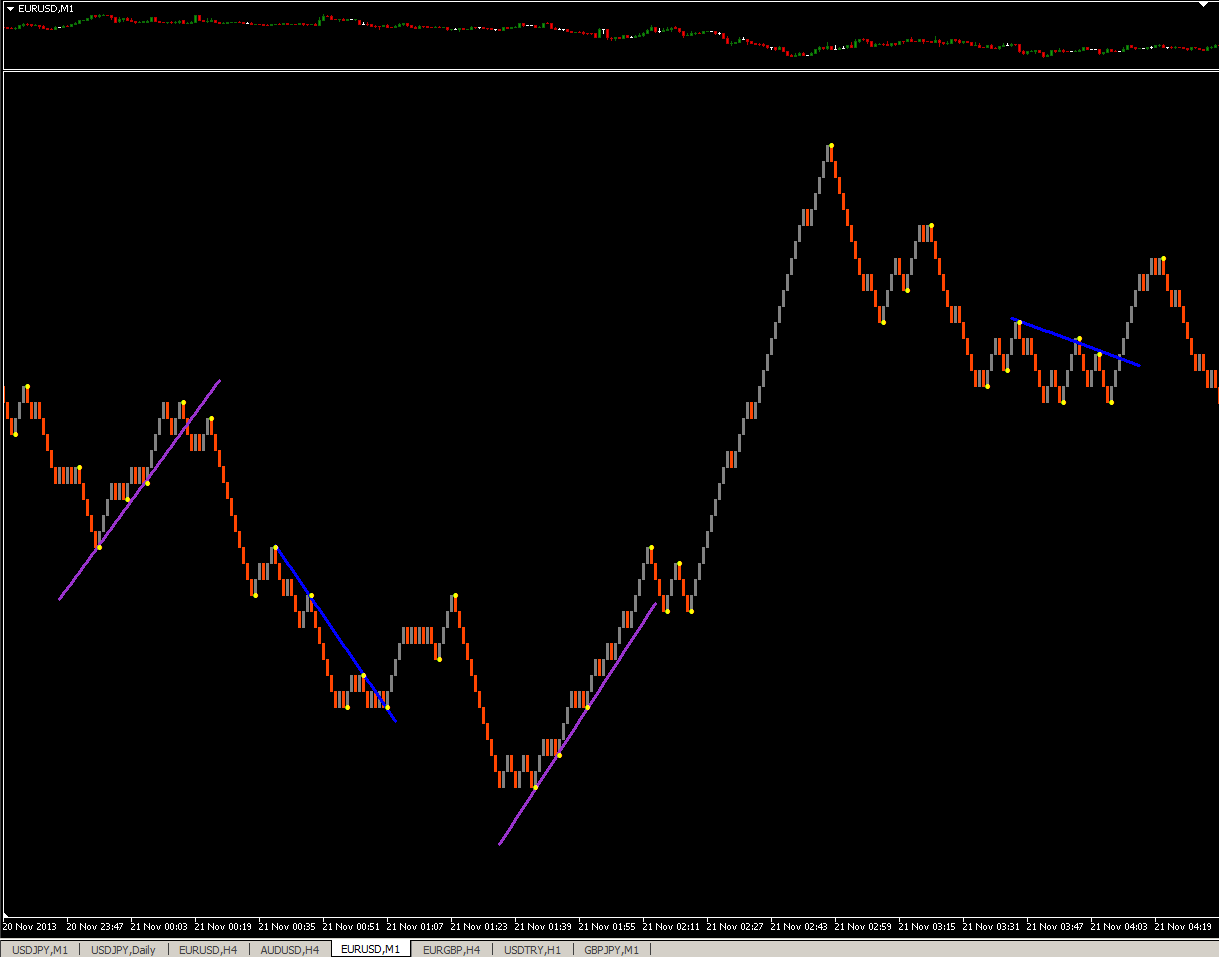
Hey guys, I am making an EA but I want to include an indicator that will detect a trendline and use it to determine if a trade should be opened. My problem is how I can construct an indicator that will figure what I did with this chart:
How could I have the indicator determine what I just did with only the numbers that I get from the close or open arrays? What would the math be behind this?
Thank you very much.