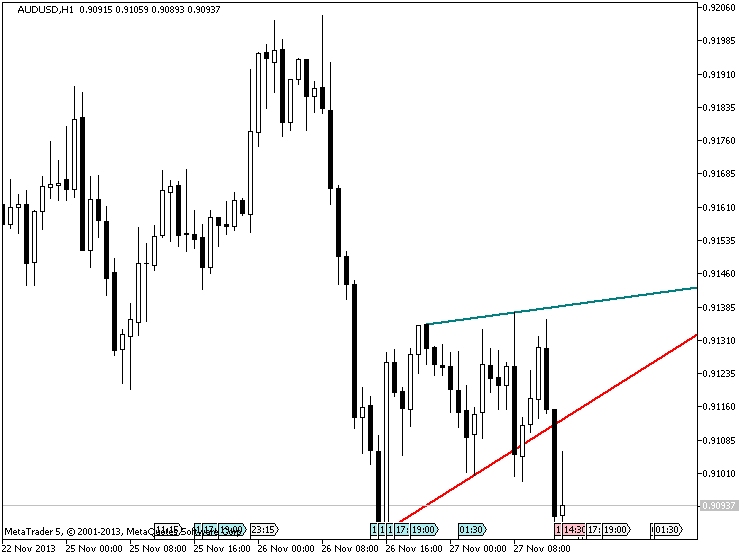
Indicators: TrendlinesDay
newdigital, 2013.10.09 18:20
How to Exit While Trading with Trendlines
Talking Points:
- Traders should focus on their exit plan just as much as their trade entries.
- Trendline traders could set their stop losses beyond the nearest support or resistance level and set their limits within the nearest support or resistance level.
- Setting exit prices according to support and resistance levels could tip the odds in your favor.
Many traders have a strong set of rules that they follow to enter trades, but have difficulty in selecting their exits. This is troubling because how we exit a trade should be just as important, if not more important than how a trade is entered. After all, our exits ultimately determine if our trades are profitable for us or not. So we need to make sure our exit strategy is just as logical as our entry strategy.
When we place our trades based on trendlines, we are placing them based on support and resistance levels. We are thinking the price will bounce off a trendline like it did in the past. I propose we use the same logic when setting our stops and limits.
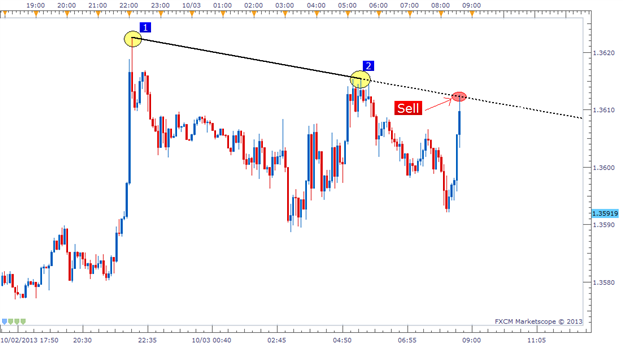
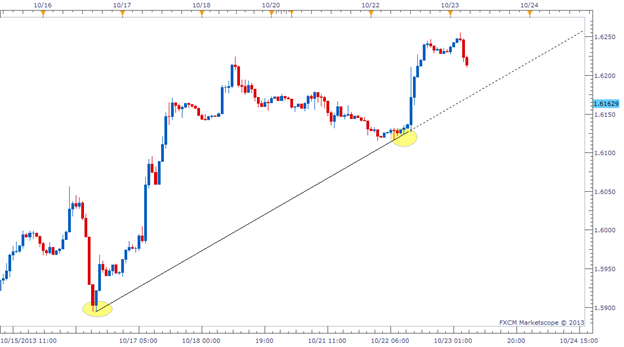
In the example above, it’s easy to see the sell entry that was given to us based on the bearish trendline. We entered right at the trendline looking for a bounce back down, but where do we want to exit? When do we call it quits if the trade goes against us? Where do we place our profit target? Let’s take a look.
Setting Stops Beyond Support/Resistance
We need to look at placing our stop somewhere above this trendline. If the resistance is broken through, we were wrong on the trade and should accept the loss quickly. It’s possible that price could return back to profitable territory after breaking this resistance, but we cannot rely on being lucky. We can only trade based on what we see.
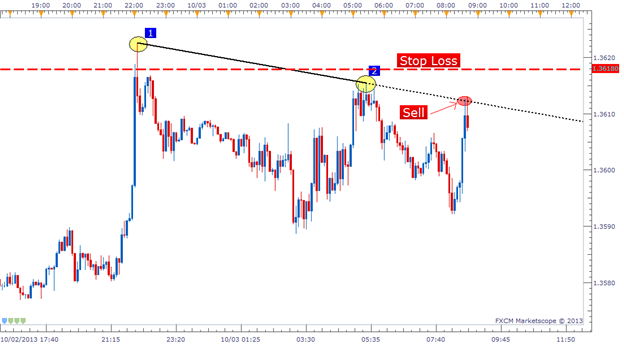
I like to set my stop 5-25 pips from the closest support/resistance level depending on the time frame I am trading. The smaller the time frame of the chart, the tighter I will place my stops. On this trade, I set my stop 5-6 pips away from my entry since that was beyond the resistance line as well as the previous swing high (Bounce #2).
Remember that when we set our Stop loss, this is also setting our monetary risk on the trade. So we also need to consider our trade side in respect to our Stop loss distance.
Setting Limits Within Support/Resistance
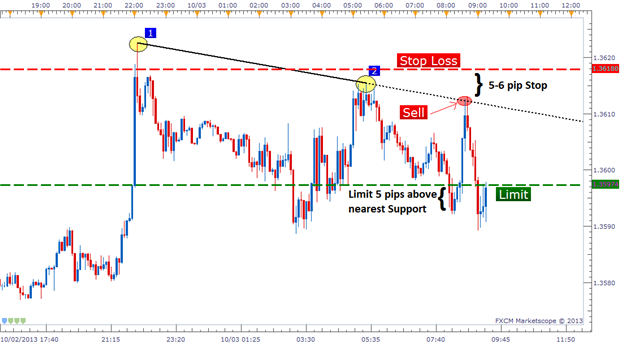
Now that our stop is set, we need to focus on our profit target. For our limit placement, we have two objectives:
- Our limit’s distance needs to be further than our stop’s distance.
- Our limit needs to be placed within the closest support/resistance (by at least 5 pips).
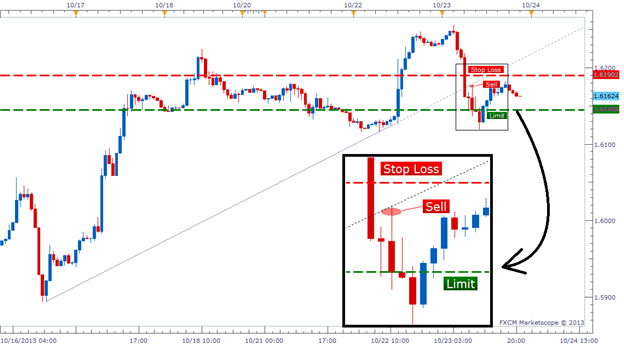
And the reason we want our limit to be placed within the closest support/resistance level (by at least 5 pips) is for the exact same rationale we used to open this trade to begin with. We know prices have a tendency to bounce off price levels they have bounced off of before, so we want to make sure that no support/resistance is in between our entry and our limit level. In the example below you can see I placed my limit 5 pips above the swing low (potential support). This gives price a clear path to a profitable trade.
Trendline Strategy Complete
This trendline strategy is one that can be used universally across all currency pairs and time frames so it is definitely a worthwhile style of trading to learn. The logic behind the entry and exit rules is also something that can be tailored to other types of strategies as well. Good trading!
Indicators: TrendLine Touch Alert
newdigital, 2013.10.24 09:01
Simple Way to Trade Trendline Breakouts
Talking Points:
- Always wait for the current candle to close beyond the trendline to confirm the break.
- Enter into the trade when price retraces back within a few pips of the original trendline, trading in the direction of the original breakout.
- Set your Stop a few pips beyond the trendline and set your Limit at least twice as far as your Stop.
Step 1. - Locating the Trendline
As a review, a trendline is a line connecting two or more lows or two or more highs, with the lines projected out into the future. Traders than look at these projected lines and look for future prices to react around those levels.
Step 2. – Wait For a Confirmed Breakout
Next, we need to see how the price reacts to the projected trendline. There are two potential outcomes when price comes into contact with a trendline:
- The price will bounce off the trendline
- The price will break through the trendline
So we wait to see if the price does in fact break through the price. But we aren’t ready to place a trade just because the price breaks through the trendline. We need to wait and see if the current candle closes beyond the trendline. We require a candle to close beyond the trendline to confirm the breakout. This is a very important rule.

Check out the chart above depicting a trendline on a current USD/JPY Hourly chart. There were two times in the past week where this trendline was broken, but look what happened. They were false breakouts. Sellers were not able to keep the price down below the trendline and both potential breakout candles closed above the trendline. Had we sold at either of those two opportunities, we would have been crushed two times in a row. Something we definitely want to avoid.
So even though it is tempting to get immediately into a trade as price breaks a trendline in real-time, you would be susceptible to false breaks. Patience is a virtue.
Step 3. Set Up The Trade
Remember the first image I showed you of the GBP/USD Hourly chart? Let’s go back to that example because it actually ended up producing a near perfect breakout setup. Soon after that snapshot was taken, the GBP/USD fell and broke through our trendline with authority. A very short time after that, the Hourly candle closed below the trendline and confirmed the breakout as well. Once this happened, it was time to get to work to setup this trade.
There are 3 things we needed to do to execute this breakout trade:
- Set an Entry order to Sell just below the original trendline.
- Attach a Stop order several pips above the trendline.
- Attach a Limit that is as least twice as large as our Stop (increase your trading profitability by learning the importance of the risk/reward ratio).
There is a saying that goes “What once was resistance, can later become support. And what once was support, can later become resistance.” This is the mantra we rely on when setting an Entry order near the original trendline. We are looking for price to retrace back to the point of support/resistance it just broke through, and then continue back into the direction of the original breakout. Take a look at how the trade was setup below.
Our Entry order to Sell was placed a couple pips below the trendline, our Stop Loss was set several pips above the trendline (approx.. 15 pips from our Entry) and our Limit was set twice as far as our stop (approx. 30 pips from our Entry). Within the next hour, the price retraced back to the original trendline, and then move back in the direction of original breakout, exactly what we wanted.
So to recap, we were able to enter into a trade on a confirmed breakout, we were able to get in at a much more favorable price than entering the break in real-time, and we were able to set an extremely tight stop (read: lower our risk) beyond what should be a valid resistance level.
As it turned out, this particular trade was a success, but that doesn’t mean every trade will be a winner. However, you should take comfort in the fact that as long as you are using a 1:2 risk/reward ratio, you only need to be correct 33% of the time to break even. If you are right more than 33% of the time, you should be a profitable trader in the long run with this strategy.
Breaking Bad
Trendline breaks can be tricky to trade, but hopefully this article gave you a clear approach to mastering them. We've learned that you should always wait for confirmation of a break by requiring the current candle to close. We also learned placing our Entry order near the trendline will give us a better entry price and reduce our risk by allowing a tighter Stop. Setting our Limit as least twice as far as our Stop should also help shift the odds in our favor. Good luck with your trading!
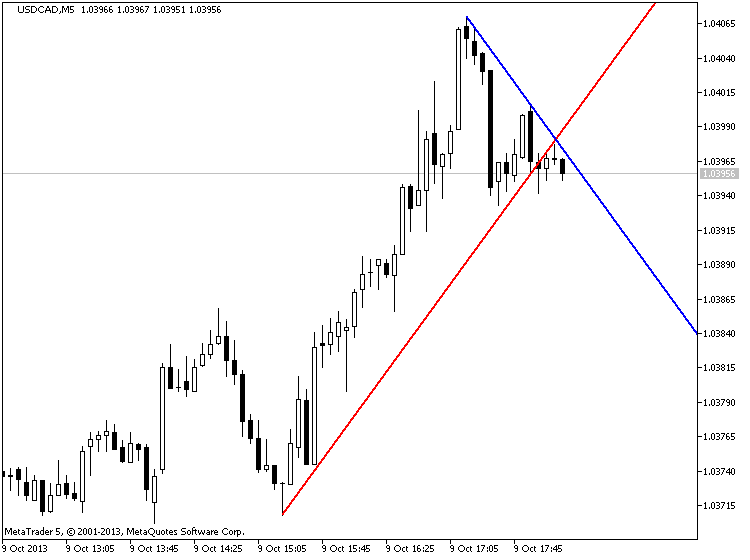
Just an example of using this indicator :
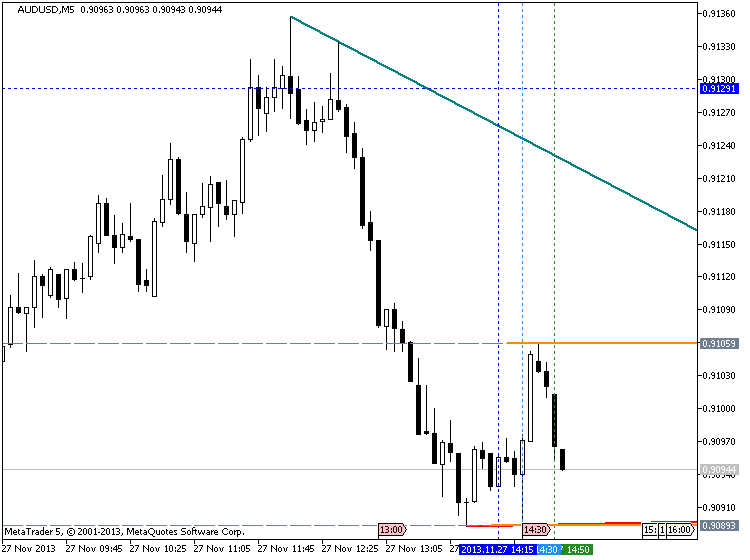
example of trend line breakout using this indicator :
- Free trading apps
- Over 8,000 signals for copying
- Economic news for exploring financial markets
You agree to website policy and terms of use
TrendlinesDay:
Author: Nikolay Kositsin