Hello,
I'm trying to develop an expert that digs the historical data (peak and bottoms) to be used for my main expert. I decided to use zigzag indicator since it's simple and finds the high/low easily.
My problem is, when I call the ZigZag.ex4 using iCustom() function I cannot get the correct high and low values. In order to avoid re-painting, I used index 20 of the iCustom() indicator as a basic protection for repanting.
There are two buffers in ZigZag code (using the metaquotes version https://www.mql5.com/en/code/7796 ). I might take the high and low values opposite but it doesn't matter too much at the moment.
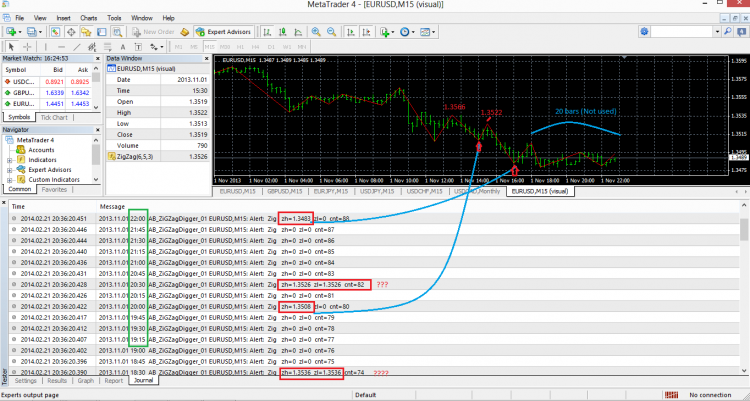
Some of the values match with the code some does not and in the Journal, I can see both high and low values in the same column which cannot be possible.
My code is below:
I wonder if I'm using the zig zag indicator wrong or if I made a mistake on the code? I could not find the issue so I kindly ask your help to identify my problem.
Thanks
Can you tell reading the code MACD Sample how that EA works ??
Looks to me you never tried ....
what you have written is like I do something ..... don't know what happens Can you tell me what I did ??
Every tick loop what is your every tick loop ??
This ??
   if (tmp!= Time[0])

   {  tmp =  Time[0];

      double zh=iCustom(Symbol(),0,"ZigZag.ex4",6,5,3,1,20);
      double zl=iCustom(Symbol(),0,"ZigZag.ex4",6,5,3,0,20);

      Zig_high[cnt]=zh;
      Zig_low[cnt]=zl;
      cnt=cnt+1;

      Alert(" Zig   zh=",zh,"  zl=",zl,"  cnt=",cnt-1);

  } // Every tick loop
yes then where is the loop ??
no then explain line by line what your code means...
Yes I know that it will not fill every buffer element. I want to put all data to an array including zeros (if there are no high and low) and also the high and low values. The reason for that is I would like to have another process inside deinit() to calculate the tick difference between high and lows using the arrays. I mean eg. how many ticks has been passed between 2 highs and the difference between high and low. But I cannot come to that stage yet.
Why it both returns high and low at the same time as I figured in the picture (journal part with ??? mark next to it?) And these values does not correspond to any high or lows... This is my main issue...
Thanks
Can you tell reading the code MACD Sample how that EA works ??
Looks to me you never tried ....
what you have written is like I do something ..... don't know what happens Can you tell me what I did ??
Every tick loop what is your every tick loop ??
This ??
yes then where is the loop ??
no then explain line by line what your code means...
I don't think that I have issue about the loop, loop works and prints out the results. it checks the timeframe (15M in my case) and calculate the zigzag values and prints. Please check the green rectangle how it works every 15 minutes. Start() function itself is a loop, isn't it?
I don't think that I have issue about the loop, loop works and prints out the results. it checks the timeframe (15M in my case) and calculate the zigzag values and prints. Please check the green rectangle how it works every 15 minutes. Start() function itself is a loop, isn't it?
You're right that Start() function itself is a loop
but where is that loop starting and where is Start() function ending ??
it is somewhere else ...
the messages you printed are not repeated every tick ....
So what are you doing ......??
Try to explain the lines of your code ..... as much as you can
My apologies if I couldn't explain properly.
This expert is to be used for backtest and my aim is to find historical highs and lows in 15M chart. I'll than re-process the high and low data to calculate phase and amplitude of the graph.
What I did it; I used two arrays to store the high and low value and one counter to count the ticks. The array size 1000 is more than enough since I'm running it for 2 days maximum (1440/15=96 ticks per day)
int cnt=0;
double Zig_high[1000];
double Zig_low[1000];
in the init() function I'm filling the arrays with zero.
in the start() function I'm checking if new tick has triggered with below code
 if (tmp!= Time[0])

   {  tmp =  Time[0];

   // the code here runs every 15M.

   }
So the start() function has a continuous loop until the backtest (2 days ) finalized.
My main issue is calling the ZigZag I think. Below I'm calling the zigzag indicator. Normally if there is a high or low it should return with a non-zero value. But in my case it sometimes returns both low and high with the same value which is impossible.
  double zh=iCustom(Symbol(),0,"ZigZag.ex4",6,5,3,1,20);
  double zl=iCustom(Symbol(),0,"ZigZag.ex4",6,5,3,0,20);

  Zig_high[cnt]=zh;
  Zig_low[cnt]=zl;
  cnt=cnt+1;
May be I did not understand the arrays used in orginal Metaquotes zigzag indicator (see below). My understanding is these are used to store high and low values.
//---- indicator buffers
double ExtMapBuffer[];
double ExtMapBuffer2[];
Thanks
Take some time reading and learning
This might help you also a little
What is Data Window displaying ??
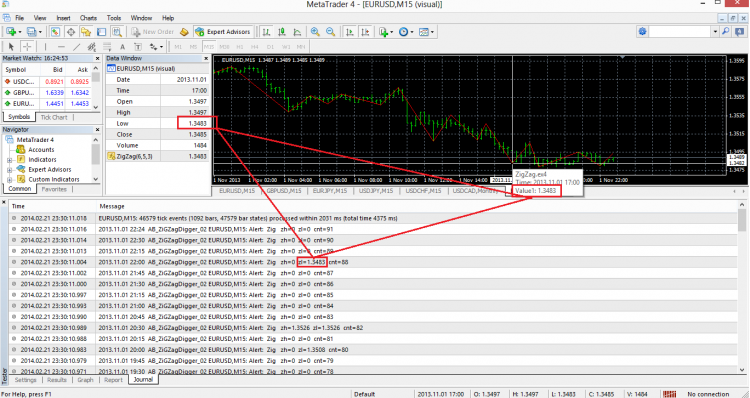
The below graph shows the minimum value (both cursor point value, data window value and output is the same)
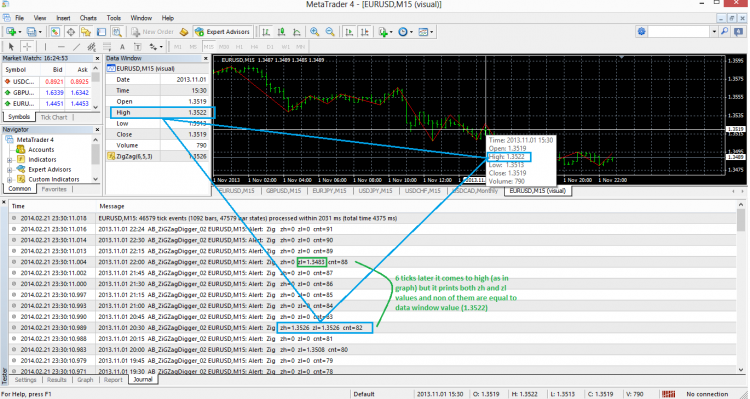
The below one is 6 ticks later the highest high part of the graph. Both data window and cursor points are same however the output is not same and besides it returns both low and high value.
I checked that iCustom() loads indicator correctly. The low value is the same but high value is not. Could it be related with ZigZag indicator?
What I'm doing wrong I really could not understand.
- Free trading apps
- Over 8,000 signals for copying
- Economic news for exploring financial markets
You agree to website policy and terms of use


Hello,
I'm trying to develop an expert that digs the historical data (peak and bottoms) to be used for my main expert. I decided to use zigzag indicator since it's simple and finds the high/low easily.
My problem is, when I call the ZigZag.ex4 using iCustom() function I cannot get the correct high and low values. In order to avoid re-painting, I used index 20 of the iCustom() indicator as a basic protection for repanting.
There are two buffers in ZigZag code (using the metaquotes version https://www.mql5.com/en/code/7796 ). I might take the high and low values opposite but it doesn't matter too much at the moment.
Some of the values match with the code some does not and in the Journal, I can see both high and low values in the same column which cannot be possible.
My code is below:
I wonder if I'm using the zig zag indicator wrong or if I made a mistake on the code? I could not find the issue so I kindly ask your help to identify my problem.
Thanks