not sure why channel indicator not drawing for past bars
Hello forum, hope you might help with this quick question
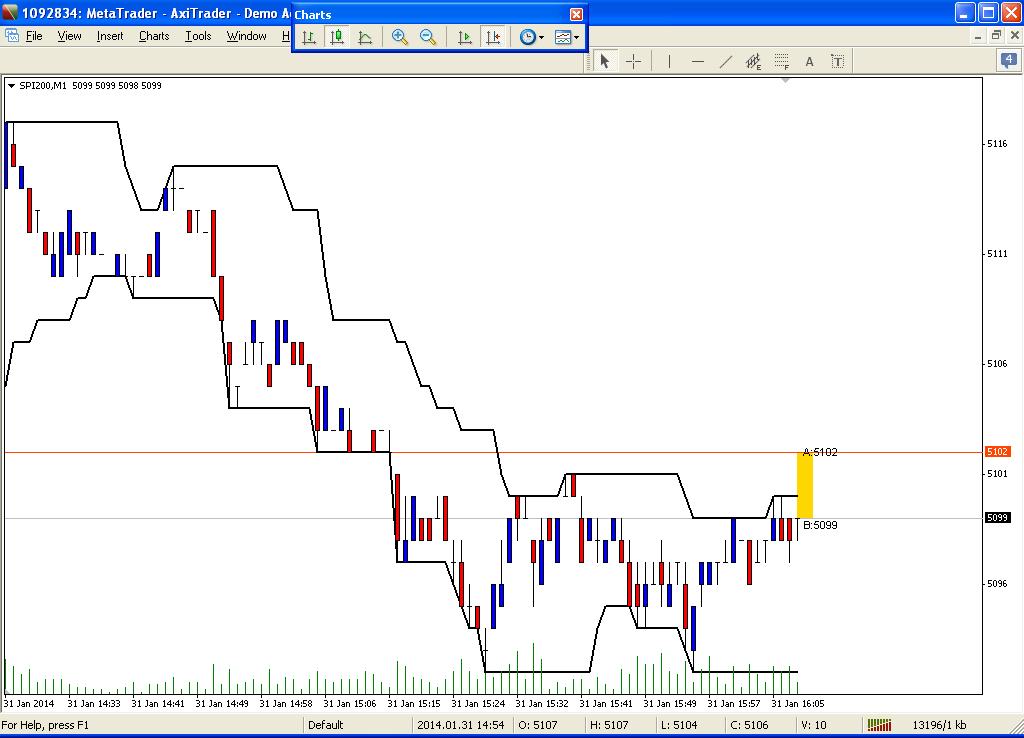
I have tried to create from scratch a simple indicator that draws a channel for the high or low values of a specified period of bars.
Yes I know there are versions of this available, but trying to learn to do myself.
Seems to work well in real time when added to the chart and the buffer draws the channel correctly as new bars form, but does not show the calculated channel for the historical bars like a bollinger band would.
Would someone point out my code error please
Thanks in advance
sorry for some reason image wont upload
Hello forum, hope you might help with this quick question
I have tried to create from scratch a simple indicator that draws a channel for the high or low values of a specified period of bars.
Yes I know there are versions of this available, but trying to learn to do myself.
Seems to work well in real time when added to the chart and the buffer draws the channel correctly as new bars form, but does not show the calculated channel for the historical bars like a bollinger band would.
Would someone point out my code error please
Thanks in advance
You are always getting the highest and lowest from bar 0 back 14 bars . . .
int high_bar = iHighest(Symbol(), Period(), MODE_HIGH, High_Low_Period, 0 );
. . . so for bar number 223 it gets the highest and lowest for bars 0 to 13 . . . instead of 0 try i and instead of High_Low_Period use High_Low_Period + i
sorry for some reason image wont upload
thanks!! that works nicely now
your help as always, so very much appreciated
//+------------------------------------------------------------------+
//|                                                     MA_Shade.mq4 |
//|                                                           oromek |
//|                                                oromeks@gmail.com |
//+------------------------------------------------------------------+
#property indicator_chart_window
#property indicator_buffers            2
#property indicator_color1             Black
#property indicator_color2             Black
#property indicator_width1             2
#property indicator_width2             2
#property indicator_style1             0 // setting of 0 means solid line, no other setting possible unless width is 1
#property indicator_style2             0 // setting of 2 makes line dotted if width is set at 1,
                                         // setting of 1 would mean dashed line etc
//------------------------------------------------------------------------------------------------------------------------------|
extern string       High_Low_Period_Help           ="High&Low-Of How Many Bars";
extern int          High_Low_Period                =14;
//------------------------------------------------------------------------------------------------------------------------------|
double              high_bar,low_bar,high,low,High_Buffer[],Low_Buffer[];
//+-----------------------------------------------------------------------------------------------------------------------------|
//| Custom indicator initialization function                         |
//+------------------------------------------------------------------+
int init()
  {
   SetIndexStyle    (0,DRAW_LINE,STYLE_SOLID);
   SetIndexBuffer   (0,High_Buffer);
   SetIndexStyle    (1,DRAW_LINE,STYLE_SOLID);
   SetIndexBuffer   (1,Low_Buffer);
//---- indicators
//----
   return(0);
  }
//+------------------------------------------------------------------+
//| Custom indicator deinitialization function                       |
//+------------------------------------------------------------------+
int deinit()
  {
   return(0);
  }
//+------------------------------------------------------------------+
//| Custom indicator iteration function                              |
//+------------------------------------------------------------------+
int start()
  {
   int i;
   int counted_bars=IndicatorCounted();
   i=Bars-counted_bars-1;
   //---- the last calculated bar will be recalculated
   if (counted_bars > 0)
       counted_bars--;
   int limit = Bars - counted_bars;

   i=Bars-counted_bars-1;                                            // Index of the first uncounted
   while(i>=0)
   {
      // get the bar (or candle) of the highest high
         high_bar = iHighest(Symbol(), Period(), MODE_HIGH, High_Low_Period, i);
      // use the bar as an index to get the high value
         High_Buffer[i] = iHigh(Symbol(), Period(), high_bar );

      // get the bar (or candle) of the lowest low
         low_bar  = iLowest(Symbol(), Period(), MODE_LOW, High_Low_Period, i  );
      // use the bar as an index to get the low value
         Low_Buffer[i]  = iLow(Symbol(), Period(), low_bar );
   i--;
   }

   return(0);
  }
- No need for the decrement Contradictory information on IndicatorCounted() - MQL4 forum
- Your Highest/lowest looks back High_Low_Period bogus call when i is near end of the chart.
   int counted_bars=IndicatorCounted();
   i=Bars-counted_bars-1;
   //---- the last calculated bar will be recalculated
   if (counted_bars > 0)
       counted_bars--;
   int limit = Bars - counted_bars;

   i=Bars-counted_bars-1;
   int counted_bars=IndicatorCounted();
   if(counted_bars < High_Low_Period) counted_bars = High_Low_Period; // Look back
   i=Bars-counted_bars-1;
- Why call a function when you can just use the predefined variables
//      High_Buffer[i] = iHigh(Symbol(), Period(), high_bar );
        High_Buffer[i] = High[high_bar];
- No need for the decrement Contradictory information on IndicatorCounted() - MQL4 forum
- Your Highest/lowest looks back High_Low_Period bogus call when i is near end of the chart.
- Why call a function when you can just use the predefined variables
Thanks WHRoeder, you are a mind reader.
My next post was going to seek some assistance with the basic explanation of decrementing and indicator counted and the varying way coders use this for indicators.
I have read the relevant part of the book and various code base threads numerous times on this topic, but still remained confused as I tried to ensure that my indicators did not repaint or chew up unnecessary computing power.
Agree and understand your points / suggestions 2 and 3.
Will keep reading https://forum.mql4.com/39632 until I understand it fully.
Thanks Again
- Free trading apps
- Over 8,000 signals for copying
- Economic news for exploring financial markets
You agree to website policy and terms of use
Hello forum, hope you might help with this quick question
I have tried to create from scratch a simple indicator that draws a channel for the high or low values of a specified period of bars.
Yes I know there are versions of this available, but trying to learn to do myself.
Seems to work well in real time when added to the chart and the buffer draws the channel correctly as new bars form, but does not show the calculated channel for the historical bars like a bollinger band would.
Would someone point out my code error please
Thanks in advance