not sure how to plot histogram on chart with defined top and bottom
Hello forum, hope you might help me with this.
I put together and indicator that basically showed me in histogram form on separate chart window where a moving average (properties variable) was in relation to a fixed Bollinger Band of 1 standard deviation wide.
This worked fine, but I thought it might be more useful to have the histogram plotted on the main chart.
I looked at the Ichimoku indicator for guidance, but still can not work out how to define the indicator buffer
For each Histogram you need 2 buffers, one for the upper value of each bar and one for the lower value of each bar.
For each Histogram you need 2 buffers, one for the upper value of each bar and one for the lower value of each bar.
I am getting closer with this, but need a little help with the very last part as am doing something wrong right in the last lines of code with the buffers.
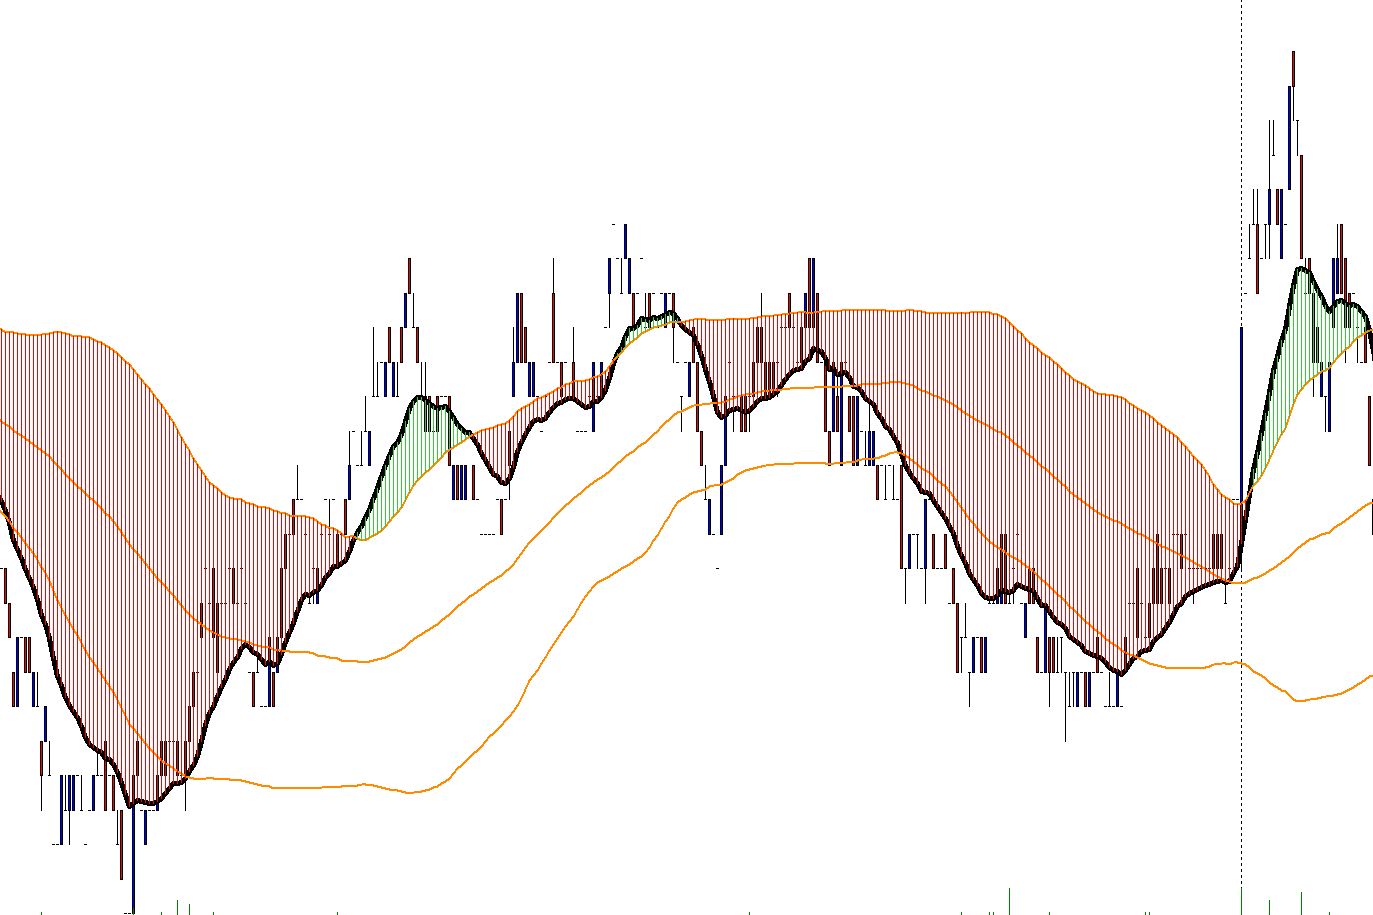
I am trying to have the area between the black moving average and the bollinger bands shaded green when the moving average is above the upper bollinger band,
shaded red when the black moving average is below the lower bollinger band;
and shaded yellow when the black moving average is between the bollinger bands.
I have tried so many combinations that I am now totally confused, I can get one or two of the shaded areas to work at any one time, but not all 3 at once.
I will attach the code and hoping someone might be kind enough to help me sort out the buffers, such that I get the desired colours.
I thought I could simply define 2 buffers for each area, but obviously I am doing something wrong
Any help appreciated
Regards
Dave
- Free trading apps
- Over 8,000 signals for copying
- Economic news for exploring financial markets
You agree to website policy and terms of use
Hello forum, hope you might help me with this.
I put together and indicator that basically showed me in histogram form on separate chart window where a moving average (properties variable) was in relation to a fixed Bollinger Band of 1 standard deviation wide.
This worked fine, but I thought it might be more useful to have the histogram plotted on the main chart.
I looked at the Ichimoku indicator for guidance, but still can not work out how to define the indicator buffer
For example if I have a moving average above the Bollinger Band and want:
-------the area between the moving average and the top band of the Bollinger band shaded with the histogram.
I know the high of my histogram should be the moving average value and the low of the histogram should be the upper bollinger band value, but how do I define this?
Would someone please help me with this?
I have attached my attempt at code "draft-MA-rel-BB100 on chart" (not working yet) to try and do the above before having to stop because of a knowledge gap.
thanks in advance
Dave