MQL4 Horizontal Object (specific time)
Hello Guys
im using the below code to draw horizontal lines
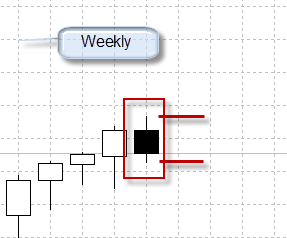
it works fine and it draw line for whole chart, now i want to change it to draw it for specific time .... how can i make it ? i want to draw it for one week only, or one day only.
Thanks
Use a trend line instead . . . OBJ_TREND
Hi Simon
something like this?
ObjectCreate("حد بالا", OBJ_TREND, 0, TIME 1, TL_d, TIME 2, 0);
Imagine today is Sunday and i want to draw a line for coming week, what should i put int he Time 1 and Time 2?
Hi Simon
something like this?
Imagine today is Sunday and i want to draw a line for coming week, what should i put int he Time 1 and Time 2?
Hi Simon
something like this?
Imagine today is Sunday and i want to draw a line for coming week, what should i put int he Time 1 and Time 2?
Time1 is same as iTime(Symbol(),PERIOD_W1,0)
Time2 is 60*60*24*7 seconds more then time1
Time1 is same as iTime(Symbol(),PERIOD_W1,0)
Time2 is 60*60*24*7 seconds more then time1
Hi
when i put the parameter you mentioned, i can manage the end of HLine but i cannot fix the start of HLINE ( by analyzing the previous Week i want to put a HLINE for current week. do we have a parameter that show the start time/end time of a candle?
 c
c
As Raptor has already told you, use a trend line.
Although you have to input a time parameter when drawing a horizontal line, only the price is used and so the line will be the full width of your chart.
If you want your line to start and end at certain times, use OBJ_TREND
Hi
iTime(NULL,PERIOD_W1,0)
im using the above code for Time1 but its not working,
ObjectCreate("حد بالا", OBJ_TREND, 0,iTime(NULL,PERIOD_W1,0),TL, 60*60*24*7, TL);
60*60*24*7
is not a time, it is the amount of seconds in a week
iTime(NULL,PERIOD_W1,0) + (60*60*24*7)
might do what you want
Hello Guys
this one worked for me :) thank you all
Thank you GumRai, Simon, DevRies
but i think i should be careful about those weeks that has holidays i guess :)
ObjectCreate("حد بالا", OBJ_TREND,0,iTime(NULL,PERIOD_W1,q),TL,iTime(NULL,PERIOD_W1,q)+60*60*24*7,TL);
- Free trading apps
- Over 8,000 signals for copying
- Economic news for exploring financial markets
You agree to website policy and terms of use
Hello Guys
im using the below code to draw horizontal lines
it works fine and it draw line for whole chart, now i want to change it to draw it for specific time .... how can i make it ? i want to draw it for one week only, or one day only.
Thanks