Thank you,
But the trend line is not drawed in the graphic, so i can't use this function, i need to calculate it with A(x,y) and B(x,y)
I want to use this value as a filter in EA. Exemple if (Bid-Yc<150*Point) ---> don't sell
Thank you,
But the trend line is not drawed in the graphic, so i can't use this function, i need to calculate it with A(x,y) and B(x,y)
I want to use this value as a filter in EA. Exemple if (Bid-Yc<150*Point) ---> don't sell
Well you did say in your OP "I have a trend line and 2 point A and B", so it is reasonable to assume that you have a trend line drawn on your chart.
I seem to remember Raptor posting a link a number of times for when this question comes up. I may be wrong, but will wait to see if Raptor answers your question.
i thought also but seems when it is an example it will be different
then the trendline is not the trendline ???????
- Then you don't have a trend line you have two points. Don't mislead.
- Learn some sixth grade algebra. Try Googleing "points to line" and you find Lines - Cool math Algebra Help Lessons - Finding the Equation of a Line Given Two Points or Equation of a Line from 2 Points
Ay - By = M(Ax - Bx) so m = (Ay - By) / (Ax - Bx); // m = slope
Ay - By = M(Ax - Bx) so
 Y - By = M(X  - Bx) so b - By = m(0 - Bx)         // b = intercept
                        b      = By - m Bx         //   = value at 0.
y = m x + b;
Thank you
in mathematics, if i have 2 point A(x1,y1) and B(x2,y2)
i want to deteterminate y3 from C(x3,y3) with x3=Time[0]
y = ax + b
y1 = ax1 + b
y2 = ax2 + b
so a = (x2-x1)/(y2-y1) and b = y1 - x1(x2-x1)/(y2-y1)
y3 = ax3 + b
so
y3 = (x2-x1)*(x3-x1)/(y2-y1)+y1
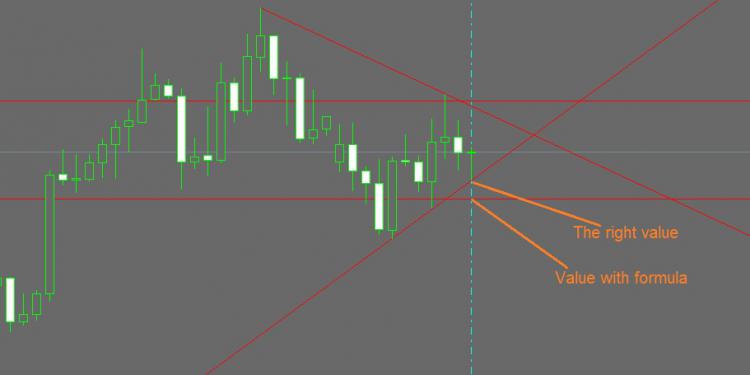
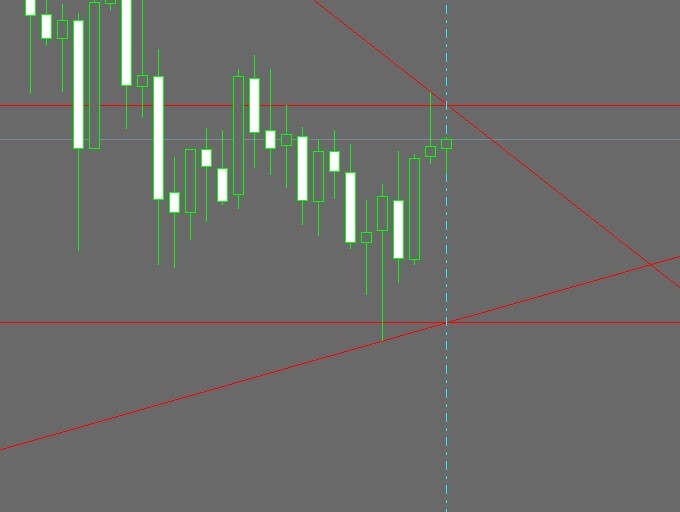
that's the formula but the problem is that it doesn't work in MQL4, if i draw the line and get the value in graphic or with ObjectGetValueByShift i have a difference more than 10pips sometime, and sometimes it's the right value
in the picture, with the same function, sometimes it work (picture2) and sometimes it deosn't work (picture 1), that's why i'm looking for another way to calculate this value
y1 = ax1 + b
y2 = ax2 + b
so a = (x2-x1)/(y2-y1) and b = y1 - x1(x2-x1)/(y2-y1)
y1 - y2 = (ax1 +b) - (ax2 +b) = Ax1 - ax2 = a(x1-x2)
a = (y1-y2) / (x1-x2) NOT (x2-x1)/(y2-y1)
b= y1 - x1(y1-y2)/(x1-x2) NOT y1 - x1(x2-x1)/(y2-y1)
Y are your prices, X is either time or bar numbers.
Hello,
it was a mistake, I am writing quickly
y3 = (x2-x1)*(y2-y1)/(x2-x1)+y1
in my function I have the right formula
it is mathematically correct,
but it doesn't work in mql4 (look the two pictute)
you can try this function and see for yourself,
Example : in the current chart EURAUD H4 i have 20 pips differance(****price_trend(7, 56,"down", Period());****), in H1 it work (i have the same value)
double price_trend(int c1, int c2, string sr, int t){

int i; double y1,y2,y4; datetime x1,x2,x4;

x1 = iTime(Symbol(),t,MathMax(c1,c2));

x2 = iTime(Symbol(),t,MathMin(c1,c2));

x4 = iTime(Symbol(),t,0);

if (sr=="down") y1 = iLow(Symbol(),t,MathMax(c1,c2));else y1 = iHigh(Symbol(),t,MathMax(c1,c2));

if (sr=="down") y2 = iLow(Symbol(),t,MathMin(c1,c2));else y2 = iHigh(Symbol(),t,MathMin(c1,c2));

ObjectDelete("ligne1");ObjectCreate("ligne1", OBJ_TREND, 0, x1, y1, x2, y2, 0, 0); // i don't need to draw the trend line but i draw it to see the problem

y4 = (x4-x1)*(y2-y1)/(x2-x1)+y1;

Comment(y4+"\n"+ObjectGetValueByShift("ligne1",0)); //it must be the same !!! but not always

return(y4);}

Play videoPlease edit your post.
For large amounts of code, attach it.x1 = iTime(Symbol(),t,MathMax(c1,c2)); y1 = iHigh(Symbol(),t,MathMax(c1,c2))
c1, c2 are the index's for time frame t. Unless t is zero or the current's Period() they can't be calculated from the current chart. How did you calculate them?
this is not the problem
- Free trading apps
- Over 8,000 signals for copying
- Economic news for exploring financial markets
You agree to website policy and terms of use


Hello
For exemple I have a trend line and 2 point A and B
A : x=Time[i] -------- y=Low[i] (Or High)
B: x=Time[j] --------- y=Low[j] (Or High)
How can i identify the price of the trend line in Time[0]
C: x=Time[0] ---------- y = ?
Thank you