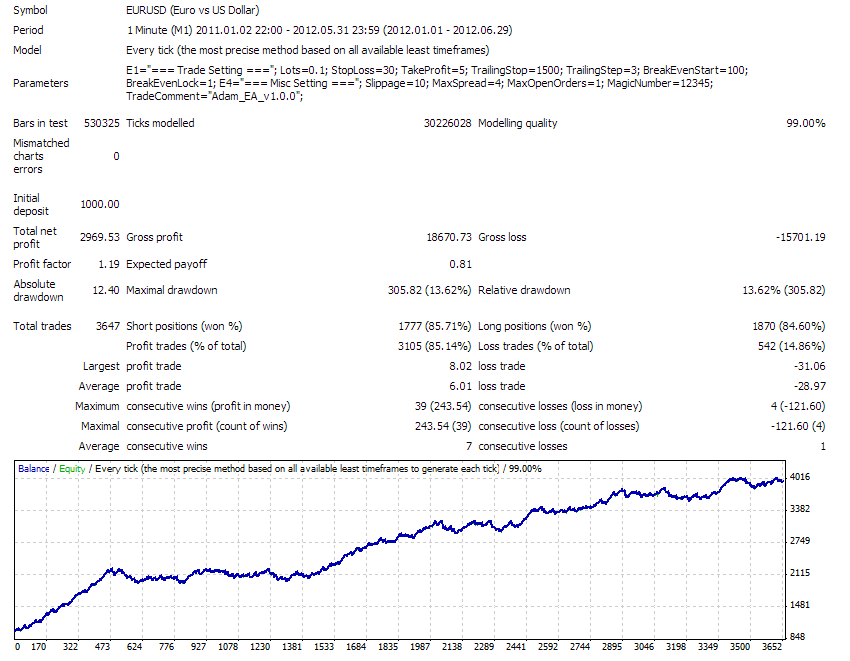
What do you think about a backtesting with 99% of model quality data?
Hi bearnaked, doesnt say much that without the rest of its supportive data/report:
1. It could have been trading over any period that one shouldn't find too impressive if it's too long: was it the minute chart over 1 month and a scalper made 17000 trades to the above tune? THAT would be fairly impressive. If it's over 10 years... it's so-so. And then again, that may just be lil ole greedy me... thats been losing for quite bit now for that...!
2. If the modeling quality is 99% that should say something for it and even more impressively so if it's over a long time.
Here's a pic Ive just run.

It is the result of a curve fitting. Optimizing a system for a long period back in history and getting such a curves is not a big deal.
You will get similar equity curves with the most of over-optimised systems, and they will blow you account in 2 week, hehe...
If you want to know the real performance of a system apply Walk Forward Analysis with fixed amount of lots ! If the system still produces such a nice equity curves , you got a holy grail, and in short period you are going to become a millionaire.
But do not worry, is not going to be the case (I suppose someone intends to sell you the above system for 100 bucks, may be 150 ? Some may ask even 2500 ! Huhhh. Think a bit about, if they have such a system, which is able to make for them thousands in a week, why they are so eager to sell their holy grail system for peanuts or for couple of thousand of bucks?)
Can't be answered. Run with a different year. Rerun with different spread. How sensitive is it to slippage? $13K profit over how long (10 years, oh hum.)
The slippage is not fixed. It's variable. I am using a paid software to do backtest. I downloaded data from Dukascopy.
I get the same average of profit from 2011/2012 and now, 2013.
The slippage is not fixed. It's variable. I am using a paid software to do backtest. I downloaded data from Dukascopy.
I get the same average of profit from 2011/2012 and now, 2013.
There is no slippage even if you use tick data, the Strategy Tester does not simulate slippage. It may simulate a variable spread, but that is not the same as slippage.
Raptor, have you sure?
I am asking that, because looks like that the tool that I use, allow simulate slippage and also spread variable. I won't say the name of the software, but is a famous software around internet.
Hi bearnaked, doesnt say much that without the rest of its supportive data/report:
1. It could have been trading over any period that one shouldn't find too impressive if it's too long: was it the minute chart over 1 month and a scalper made 17000 trades to the above tune? THAT would be fairly impressive. If it's over 10 years... it's so-so. And then again, that may just be lil ole greedy me... thats been losing for quite bit now for that...!
2. If the modeling quality is 99% that should say something for it and even more impressively so if it's over a long time.
Here's a pic Ive just run.
here is my screenshot statement
- Free trading apps
- Over 8,000 signals for copying
- Economic news for exploring financial markets
You agree to website policy and terms of use
Guys...
I am here only for one purpose. To know your opinion about this graph chart.
I've downloaded data from Dukascopy and used Tick Data Suite.
Can you share your experience with me about backtesting?
Best regards,
BearNaked