I'm trying to figure out flowchart for this price action strategy
Hi, my first post here. :) I'm a beginner trader as well as beginner coder. I've been trading by simply using naked charts with hand drawn lines mostly. Also mostly binary options so far but starting with spot as well. I've had success so far using this price action strategy but staring at computer for a long time waiting is rough. I thought it would be a good time to start a project on an indicator with alert that will notify me before a possible setup like this. I like to learn so its a win win. It can also draw S/R lines. Would probably help to show its working properly. I can figure that out though. :)
Ok, so I've been thinking about how to go about this and its just way over my head. I can't think of a good way to make it work 'yet'. Using the pic of the chart above as an example, I'm still having a tough time even simply putting it into numbers and logic for mt4. Explaining it to someone is very easy and described in the video very well. Very easy to understand.
1st check needs to be for momentum. Maybe check 5 bars back and if close price is say 25 pipette's lower go onto check 2. Seems easy enough but 25 pipette's may not be right. Might be better to use a range? Any better way to check for momentum? I'm researching this as well.
2nd check should be for support once downwards momentum is found(using example from above so downwards)and draw it on chart. I'm still thinking comparing last two candle closing prices and if within say 0-2 pipette's should work. Don't quote me on that.
3rd check should be to check if last candle close price is above support found.
4th check... I'm not sure what to do here to wait for price to pullback and back down. How many candles should I wait for to start check again? Maybe just check to see when price broke(explained in step 5) It gets a bit complicated for me quickly as you see. I know I can experiment and I will. :)
5th check to see if price broke the previous support after going back down
6th check for next support line(same as step 2)and draw line on chart
7th check for bounce from last support
8th check if price touches support from 6th step(now resistance)and sends alert.
Again, this is rough but you can see I've been thinking about it correct or not. Any help would be greatly appreciated!
Thanks again!
I really hope this makes sense and any help is greatly appreciated!
Ok, so I've been thinking about how to go about this and its just way over my head. I can't think of a good way to make it work 'yet'. Using the pic of the chart above as an example, I'm still having a tough time even simply putting it into numbers and logic for mt4. Explaining it to someone is very easy and described in the video very well. Very easy to understand.
It's not enough to say "check if support is broken", you have to define what you mean by Support. Forget coding, forget MT4, write it down for another person to replicate what you do, if you can't then I would suggest you don't know what you do or what you are doing is not following a consistent method.
- Free trading apps
- Over 8,000 signals for copying
- Economic news for exploring financial markets
You agree to website policy and terms of use
Hi, my first post here. :) I'm a beginner trader as well as beginner coder. I've been trading by simply using naked charts with hand drawn lines mostly. Also mostly binary options so far but starting with spot as well. I've had success so far using this price action strategy but staring at computer for a long time waiting is rough. I thought it would be a good time to start a project on an indicator with alert that will notify me before a possible setup like this. I like to learn so its a win win. It can also draw S/R lines. Would probably help to show its working properly. I can figure that out though. :)
https://www.youtube.com/watch?feature=player_embedded&v=EiyDIyL0tQY
Here's a pic of an example:
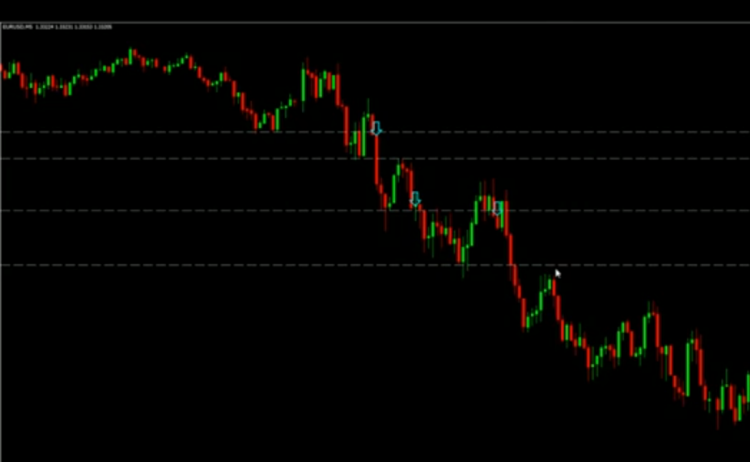
The reason I'm posting is I need help with a flowchart to get me started. I've been going through the book and its pretty straight forward to me but the logic is what I really need some help with. Not looking for anyone to do the work for me but some help with analyzing the actual conditions shown in the pic would be great. I need to be able to determine that there is decent momentum in a direction as well as determine some decent support/resistance levels. I know this for sure. coming up with a range of candles/bars to work with is first problem though. I can start to draw out a flowchart for my idea so far maybe that will help?
If anyone can provide some guidance it would be greatly appreciated. I'll keep reading the book and checking out code and even if there's no response I'll post back and update on my progress. I don't have all that much spare time these days so its going to be a little while.
Thanks for reading!