Holy Grail of the Strategy Tester
This is just an example to demonstrate the ability of a MT4 Expert Advisor (non-scalping EA) to produce great results on the MT4 Strategy Tester. These results, with same MT4 EA and settings, are not producible on a forward Demo or Live Trading account.
Why? Lack of Strategy Tester to have full tick simulation of Bar Bid/Ask INTERPOLATION. I personally believe that without this INTERPOLATION, majority of EAs with entry/exit points and Indicators based on Bid/Ask will not have Strategy Tester results match up with demo and Live trading.
So why don't you use real tick data then ?
Hello,
I do. New topic was just to advise the current Strategy Tester and History Center Data results are not guarantees.
Hello,
I do. New topic was just to advise the current Strategy Tester and History Center Data results are not guarantees.
Ah, I see. So what does the same test look like using same date range with tick data ?
I think that interpolation only occurs within the bars of the lowest timeframe MT4 has data for, doesn't it? Which in most cases will be M1.
A check of 10,000 M1 bars taken at random from day trading hours of EURUSD will (most often) show that around 98-99% of M1 bars have a range of <= 10 pips.
As far as I can tell, there are as many interpolation "price points" in a backtest bar as there is volume for that bar. So a bar with a volume of 20 will have its range split up into 20 points by interpolation, and each point will be assigned a price value. These price points may not be at exactly the same price that you could have traded with your broker, and they might not be in exactly the same order that they would have occurred in real life.
So surely this has (only?) two major impacts on a backtest:
1) You are not sure in what order the prices within a bar are hit.
2) You are not sure how close the actual prices were to the prices you wanted to operate at.
But neither of these issues should really affect the backtest results of an EA (which does not rely on scalping), should they?
Surely the first issue is only ever a problem if it were the case that both your SL and TP fall within the range of a single M1 bar, because you would not be 100% sure which one would have been triggered first unless you were using tick data. This not a significant problem unless the distance between SL and TP is <= 10 pips AND the price is close to that area (which is obviously less than just the 98-99% of the times that the range of of the M1 bar is <= 10 pips). If the difference between profit and loss of a potential EA is determined by a change in conditions of less than about 2% then that in itself might suggest that the EA is probably over optimized and/or is likely too unstable to trade reliably - regardless of whether one can trust the backtest results due to interpolation.
The second issue means that trades in backtests will be filled at prices which might not have existed in real life. This may mean the results might be more favourable or less favourable than in reality. In general we might expect this inaccuracy in either direction to cancel itself out over enough trades, and to be a very small influence over a few trades. I can't see a way in which it would consistently result in a far more profitable result than real life - unless the EA was specifically designed to exploit that or was over optimized, in which case these would both be far more serious problems than that posed by interpolation. Either way, the volume of each bar is different, and determined by each individual broker. One bar might have a small volume with large price movement, in which case the distance between each price point would be larger than for a bar which has large volume with little net distance moved by price. This is true of both live trading and interpolation, because trades can not be filled at a price which the broker is not offering. Each bar will have different acuity to the last even with real tick data. The differences in acuity between bars is surely greater than the inaccuracies caused by interpolation within a bar.
Interpolation should therefore only be a problem for EAs which scalp (here meaning distance between SL and TP <= 10 pips) and/or which have been over optimized to exploit interpolation. Since anybody backtesting a scalping strategy will most likely be using tick data, and over optimization is a (somewhat separate) problem in itself, the affect of interpolation is realistically a non-issue. Peculiarities in interpolation may affect future performance slightly, but the affect is surely dwarfed by other more general influences such as changing market conditions, and certainly should not be blamed for bad forward test performance. The influence of interpolation should be so minimal that a good EA will be robust enough to overcome such a small hinderance.
At least - those are the assumptions I am labouring under!
Ah, I see. So what does the same test look like using same date range with tick data ?
Good question. Just collecting tick data may not be enough. Spread data should also be collected from the Broker. This can become a data storage concern. One month of real tick/spread data can be up to many megabytes of data per currency pair. And, Strategy Tester processing speed may be dramatically slower. I'm in the process of collecting this data. Meantime, people using the Strategy Tester, as provided with the MT4 Terminal, do not have sub-Period M1 tick and spread INTERPOLATION. Only commenting that this can be a limitation.
Without the real tick/spread data, actual Bid/Ask simulation is not possible, It would probably be advantageous not to use market stops placed on Broker's Server, but to use the embedded Close{} function to initiate OrderOpen() and OrderClose() calls from EA to Broker's Server.
I'm not reporting facts, only possibilities to be tested.
I think that interpolation only occurs within the bars of the lowest timeframe MT4 has data for, doesn't it? Which in most cases will be M1.
A check of 10,000 M1 bars taken at random from day trading hours of EURUSD will (most often) show that around 98-99% of M1 bars have a range of <= 10 pips.
As far as I can tell, there are as many interpolation "price points" in a backtest bar as there is volume for that bar. So a bar with a volume of 20 will have its range split up into 20 points by interpolation, and each point will be assigned a price value. These price points may not be at exactly the same price that you could have traded with your broker, and they might not be in exactly the same order that they would have occurred in real life.
So surely this has (only?) two major impacts on a backtest:
1) You are not sure in what order the prices within a bar are hit.
2) You are not sure how close the actual prices were to the prices you wanted to operate at.
But neither of these issues should really affect the backtest results of an EA (which does not rely on scalping), should they?
Surely the first issue is only ever a problem if it were the case that both your SL and TP fall within the range of a single M1 bar, because you would not be 100% sure which one would have been triggered first unless you were using tick data. This not a significant problem unless the distance between SL and TP is <= 10 pips AND the price is close to that area (which is obviously less than just the 98-99% of the times that the range of of the M1 bar is <= 10 pips). If the difference between profit and loss of a potential EA is determined by a change in conditions of less than about 2% then that in itself might suggest that the EA is probably over optimized and/or is likely too unstable to trade reliably - regardless of whether one can trust the backtest results due to interpolation.
The second issue means that trades in backtests will be filled at prices which might not have existed in real life. This may mean the results might be more favourable or less favourable than in reality. In general we might expect this inaccuracy in either direction to cancel itself out over enough trades, and to be a very small influence over a few trades. I can't see a way in which it would consistently result in a far more profitable result than real life - unless the EA was specifically designed to exploit that or was over optimized, in which case these would both be far more serious problems than that posed by interpolation. Either way, the volume of each bar is different, and determined by each individual broker. One bar might have a small volume with large price movement, in which case the distance between each price point would be larger than for a bar which has large volume with little net distance moved by price. This is true of both live trading and interpolation, because trades can not be filled at a price which the broker is not offering. Each bar will have different acuity to the last even with real tick data. The differences in acuity between bars is surely greater than the inaccuracies caused by interpolation within a bar.
Interpolation should therefore only be a problem for EAs which scalp (here meaning distance between SL and TP <= 10 pips) and/or which have been over optimized to exploit interpolation. Since anybody backtesting a scalping strategy will most likely be using tick data, and over optimization is a (somewhat separate) problem in itself, the affect of interpolation is realistically a non-issue. Peculiarities in interpolation may affect future performance slightly, but the affect is surely dwarfed by other more general influences such as changing market conditions, and certainly should not be blamed for bad forward test performance. The influence of interpolation should be so minimal that a good EA will be robust enough to overcome such a small hinderance.
At least - those are the assumptions I am labouring under!
Very good insight.
To me interpolation can include price manipulation. Tick/spread data in backtesting will help to minimize varying external influences in non-scalping strategies. You can determine if Broker is filling trades at requested time/price by printing short trade (Sell) time/price request and time/price trade was filled. Then compare that to price recorded in Broker's History data. If trading latency and request-to-filled price is frequently disturbing, than find another broker.
After may years of coding and testing EAs, I have not seen or heard of an EA that produced same comparative results between Strategy Tester, Demo and Live. Not saying they are not out there, Just that I do know know of and have not had contact with them. They are slew of possible reasons, such as Broker type (ECN, Trading desk & etc), accuracy of testing data, curve fitting strategies and many more. Also, I believe that in all of the Automated Trading Championships, no winners have repeated their success in subsequent years. And, that includes me. I believe success in the ATC is more luck than coding skills due to lack of adequate backtesting tools. The best way to demonstrate this is to take an EA produced trading account chart with visible entry/exit points with attached technical indicators used to determine these points. Then compare Sell entries and Buy exits to that same EA generated visible chart produced in Strategy Tester with same technical indicators and date range. You compare Sell entry point and Buy exist point which do not have the spread involved. I think this best displays the interpolation discrepancies.
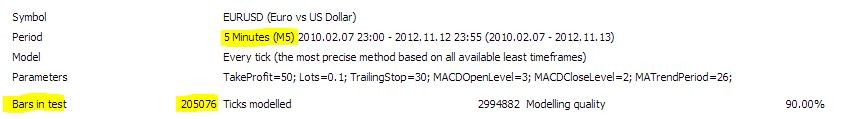
Why do you have only 3845 Bars in test for a period of nearly 2 years?
If I test over the same period I have some more:
The graph does not look like you use aggressive compounding and I have problems to believe this is only because of the spread, random ticks, bad brokers and ... Of course I am agree a backtest must not mean much compared to a forward test, but that different? Happy to hear all is fine with your history data and its because this and/or this.
hi wackena, since we all already know that the expert is garbage [for future use] would you mind providing the codes [for learning sake] and giving some explanation on how you came to choose the parameters you use?
Others like RaptorUK could test this expert on his Tick-Data Setup. And the community could benefit on how not-to create an expert.
- Free trading apps
- Over 8,000 signals for copying
- Economic news for exploring financial markets
You agree to website policy and terms of use
This is just an example to demonstrate the ability of a MT4 Expert Advisor (non-scalping EA) to produce great results on the MT4 Strategy Tester. These results, with same MT4 EA and settings, are not producible on a forward Demo or Live Trading account.
Why? Lack of Strategy Tester to have full tick simulation of Bar Bid/Ask INTERPOLATION. I personally believe that without this INTERPOLATION, majority of EAs with entry/exit points and Indicators based on Bid/Ask will not have Strategy Tester results match up with demo and Live trading.