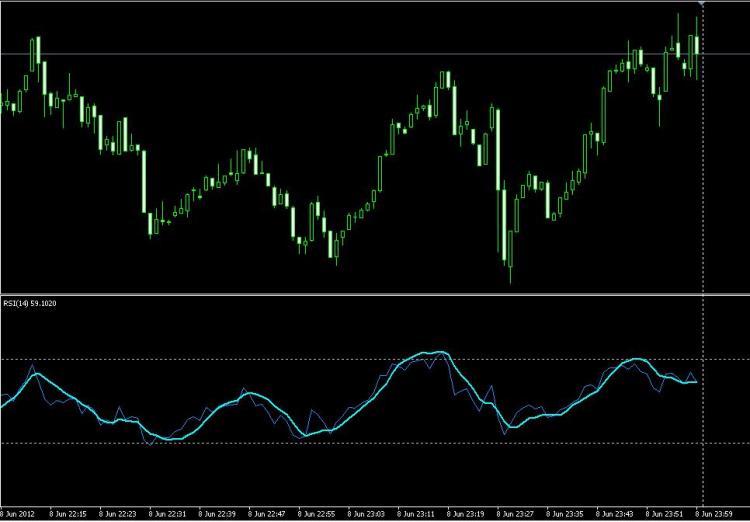
i've created a linear regression indicator with some custom changes and i want to see it plotted together with RSI indicator. Any ideas how can i achieve it?
What you have said is not clear to me. You want an RSI indicator. Ok, that is in a separate chart window. Then we have a linear regression line of a momentum indicator. Another separate chart window. If you want all these to happen at once you could set them all up as you want and save that setup as a template, right mouse click on chart Template | Save Template.
Hi dabbler,
The first indicator is RSI and the second indicator is a linear regression of RSI.
Attached you will find the code of the second indicator.
Is there a way to make both indicators appear in the same chart window?
Thank you very much
Stelios
Is there a way to make both indicators appear in the same chart window?
Well it would help if the indicator you posted actually did something useful! It firstly fills up the experts journal with >100,000 print statements, which is not very helpful :-(
Then the indicator is in the main chart window but not scaled to the price so it is not visible. And when those two items are fixed it just gives a straight line with activity only at the end, which looks fishy.
#property indicator_separate_window
#property indicator_buffers 1
#property indicator_color1 Blue

extern int LRPeriod=13;

double ind_buffer[];

int init()
  {
   IndicatorBuffers(1);
   SetIndexStyle(0,DRAW_LINE,0,1);
   SetIndexBuffer(0,ind_buffer);
   return(0);
  }

int start()
  {
   int limit, i;
   int counted_bars=IndicatorCounted();
   if(counted_bars<0) return(-1);
   if(counted_bars>0) counted_bars--;
   limit=Bars-counted_bars;
   for(i=limit; i>=0; i--) {
      ind_buffer[i]=linreg(LRPeriod,i);
   }
   return(0);
  }
//+------------------------------------------------------------------+

double linreg(int p,int i)
   {
   double SumY=0;
   double Sum1=0;
   double Slope=0;
   double c;

   for (int x=0; x<=p-1;x++) {
      c = iRSI(Symbol(), 0, 14, 0, x);
      //Print("For x = "+x +", C="+c);
      //c=Close[x+i];
      SumY+=c;
      Sum1+=x*c; }
   double SumBars=p*(p-1)*0.5;
   double SumSqrBars=(p-1)*p*(2*p-1)/6;
        double Sum2=SumBars*SumY;
        double Num1=p*Sum1-Sum2;
        double Num2=SumBars*SumBars-p*SumSqrBars;
        if(Num2!=0) Slope=Num1/Num2;
        else Slope=0;
        double Intercept=(SumY-Slope*SumBars)/p;
        double linregval=Intercept+Slope*(p-1);
        //Print("linregval: "+linregval);
        return(linregval);
        }
Now you need to use the i you pass into linreg otherwise the indicator doesn't look back in time correctly.
You also need to change the value of limit so that when i==Bars-1 the linear regression doesn't look back any further than that (in other words by LRperiod too far)
Hello dabbler and thank you very much for your messages.
Forgive me about the Print statement but i used it so i could check the result and it remained into the code that i sent.
There are two charts in my MetaTrader configuration. One is the main chart which shows the price of the currency and a second one under it which shows the RSI value.
You may see this configuration at the attached pic.
It is absolutely normal the the linear regression indicator cannot be visible at the first chart but it can be visible at the second as long as its price is comparable with the RSI price.
Fixed ...
#property indicator_separate_window
#property indicator_buffers 1
#property indicator_color1 Aqua
#property indicator_width1 1

// To be used on top of an RSI indicator, we need to scale the same as the RSI
#property indicator_maximum 100
#property indicator_minimum 0

extern int LRPeriod=13;

double ind_buffer[];

int init(){
   IndicatorBuffers(1);
   SetIndexStyle(0,DRAW_LINE,0,1);
   SetIndexBuffer(0,ind_buffer);
   SetIndexLabel(0, "LR(RSI)");
   return(0);
}
//-------------------------------------------------------------------------------+
int start(){

   int limit=Bars-IndicatorCounted() - 1 - LRPeriod;
   if( limit < 1 )
       limit = 1;

   for( int i=limit; i>=0; i-- )
      ind_buffer[i]=linreg(LRPeriod,i);

   return(0);
}
//-------------------------------------------------------------------------------+
double linreg(int p,int i){
   double SumY=0;
   double SumXY=0;
   double Slope=0;

   for( int x=0; x<=p-1; x++ ){
      double c = iRSI(NULL, 0, 14, 0, x+i);
      //Print("For x = "+x +", C="+c);
      //c=Close[x+i];
      SumY += c;
      SumXY += x*c;
   }

   double SumBars= p*(p-1)*0.5;
   double SumSqrBars=(p-1)*p*(2*p-1)/6;

   double Num1= p*SumXY - SumBars*SumY;
   double Num2= SumBars*SumBars - p*SumSqrBars;

   if( Num2!=0 )
      Slope=Num1/Num2;
   else
      Slope=0;

   double Intercept=(SumY-Slope*SumBars)/p;
   double linregval=Intercept+Slope*(p-1);
   //Print("linregval: "+linregval);
   return(linregval);
}
You need to drag the indicator onto the RSI window rather than the main window to get the regression indicator on the RSI chart.
- Free trading apps
- Over 8,000 signals for copying
- Economic news for exploring financial markets
You agree to website policy and terms of use


Hello all,
i've created a linear regression indicator with some custom changes and i want to see it plotted together with RSI indicator. Any ideas how can i achieve it?
Thank you very much
Stelios