Is it possible to guess tops and bottoms of price action? Close to a holy grail?

looks good, some points, if you use fractals don't forget that it takes 2 closed bars after the fractal to fix it. If you already have done that i always suggest to shift the buffers one bar to the right and draw the signal at the openprice. I personally do that to see at first look where i would enter the market. Maybe thats just a personal thing to not get overexited about results
Hi Flaab
Please, what is the indicator? You can attach?
Thank you very much
Michaela
This indicator is a bit old -pre stages of development-. You can check the final indicator at my website.
So you are selling this Point Zero indicator for $299.
How is this not commercial advertising and violating the rules of the site?
There is no indicators to detect top and bottom. don't be fooled. it's price react at major supports or resistances
combine this with fundamental analyst like news event. you will be able to determine it's top or bottom at that level. Nooooooo Indicator
So you are selling this Point Zero indicator for $299.
How is this not commercial advertising and violating the rules of the site?
I am very sorry for any inconvenient or disregard for the forum rules, selling it was not my initial intention (I decided to sell it far later as the development continued) .
Taichifx is right, it is impossible to guess tops and bottom and there are no holy grails.
I would delete the post if I could -but I no longer can- :-(
Cheers.
Don't take it as offensive, to predict highs and bottoms there could be 'some' need like adaptive technology, not only on fixed past movements, but also what could(would) else be as change (but of course not to go far in extreme as should be that indicator), what can worst happen (or -What's the Worst That Could Happen-)

It is just what is happening (almost always in real) without adaptive things on changes. (just my thoughts, no-one to take it as offensive).
Don't take it as offensive, to predict highs and bottoms there could be 'some' need like adaptive technology, not only on fixed past movements, but also what could(would) else be as change (but of course not to go far in extreme as should be that indicator), what can worst happen (or -What's the Worst That Could Happen-)
It is just what is happening (almost always in real) without adaptive things on changes. (just my thoughts, no-one to take it as offensive).
Hi RFB,
Yes, it is very problematical. You can find reversals using fractals and strong resistances/support, but that does not grant you a reversal. And defining reversal is also problematical: it is impossible to know how far the reversal/new trend will go. Price action is indeed, unpredictable. Therefore, finding reversals is pointless. However, every technical developer has tried at least once to do it :-)
- Free trading apps
- Over 8,000 signals for copying
- Economic news for exploring financial markets
You agree to website policy and terms of use
Hi!
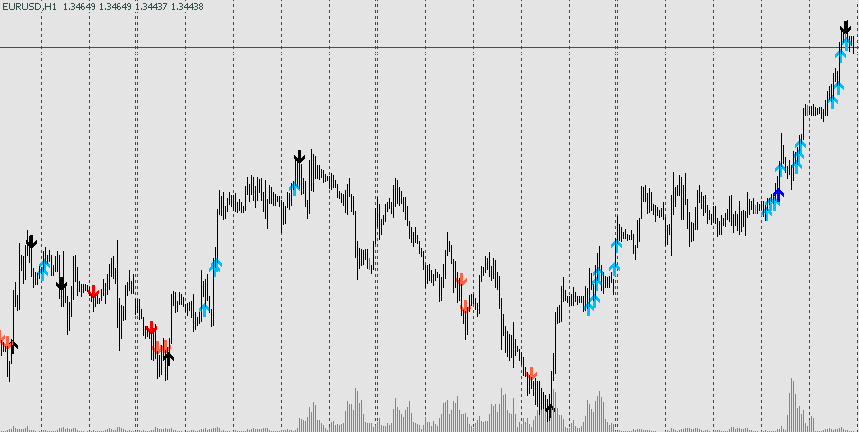
Inspired by Bill Williams and what he calls "Point Zero", I have been several days thinking about a way to detect potential tops and bottoms using Fractals, Momentum, Moving averages and Market Facilitation Index. I thought it wasn't really possible and tops and bottoms were random, but I think I am getting close by paying close attention to the evolution of the MFI over the five franctal candles. I can't share anything yet but, using just the tools I just described, my indicator is nailing lots of them. The only thing it does is filter out the fractals that do not look like PointZero.
Some clues about how to find Point Zero:
"The MFI is a measure of the market's willingness to move the price. I cannot overemphasize the value of this indicator.
It is a more truthful measure of market action than any stochastic, RSI (Relative Strength Index) or other momentum indicator."
- Bill Williams
It works better on higher timeframes, but it seems solid until 1H. It actually paints on the last closed candle -the last candle of the new fractal-.
However, it does not nail all the signals and some tops and bottoms are missed. I must make a recovery mecanism for those I miss.
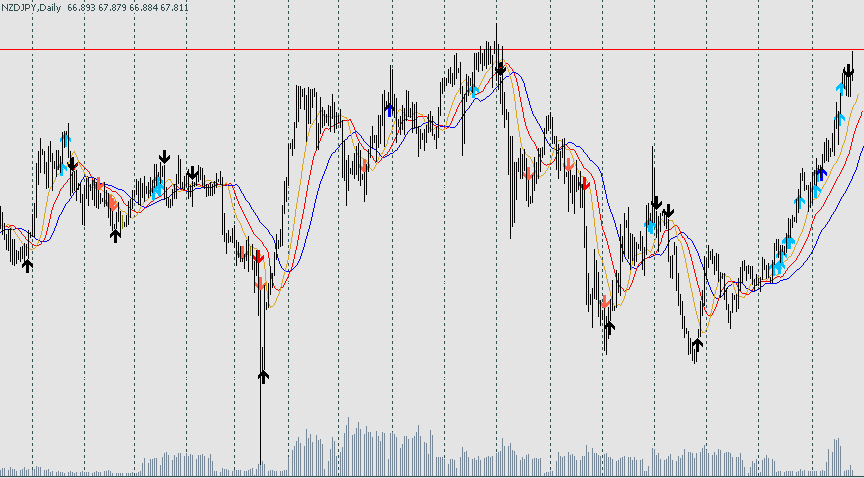
I was initially trying to find out the best exit point possible for trades. Here is a screenshot with the indicator that triggers the trades.
Black arrows signal exit points and the rest of arrows indicate trades. Darker arrows are position trades and light arrows are momentum trades.
It seems like a nice development, I am really happy.
Cheers!