Typically, the problem is with your program. I'd love to help you, but with the limited information, there is not much I can say. Go back to your algorithm and keep trying until you get the results you wish for. Welcome to the forum. Best Regards.
Wow, this is a very interesting question !!!
I thought about it quite a lot since I also developed a simple breakout system that shows the same behaviour as in your description.
Since the second half of 2007 it also behaves very nice in backtesting and makes real profit since end of April 2011.
My thoughts on this are:
I imagine to be able to see that since early 2008 volatility and volume increased. Especially since 2010.
Then I observed that my system in backtesting does less trading BEFORE beginning of the crisis in early 2008.
So i assumed that the seemingly profitable second half of the year 2007 in fact belongs to the time that makes the system loose.
That means the second half of 2007 by seeming to fit the breakout system is just an incident. The time that makes the system work starts in 2008.
However this is just trying to understand what i don't understand. Also I didn't optimize the system on the time before April 2007 because i like to use 99% backtesting quality and that isn't available for any time before that.
Now i wrote a lot of words but haven't got a real answer. But that makes the question even more interesting.
I guess it is a silly question but since i'm more or less succesfully trying to find a way to value the power of any breakout i'd be interested in how your approach looks like.
I worked tried a lot with Momentum, Force and Distance between two fast MA but could really improve the output.
this is a basic question,
what is a post-breakout filter ?
Typically, the problem is with your program. I'd love to help you, but with the limited information, there is not much I can say. Go back to your algorithm and keep trying until you get the results you wish for. Welcome to the forum. Best Regards.
That will be what is commonly known as "curve-fitting" fallacy. It has been proven this is not a desirable way to progress. Instead, it was recommended ---> Optimization, first.
- Is it a problem with MT4 tester ? <---- POSSIBLE
- Is it a problem of historical data ? <----- POSSIBLE
- Has volatility changed suddenly in 2007 ? <------ from my experience, this is not the case. The market DID get corrected then, but the supply-demand remains strengthened, if not better.
- Is it a question of volume ? <------ If you strategy/codes make use of Volume, POSSIBLE.
- Is it a matter of news ? <----- huh?? News trading, you mean? SOrry, I don't understand.
You miss another important factor - Which indicators, and their parameters did you use?
Thanks for your comments.
golomolo, diostar: No indicator, only price action. In a sense, the candles taken in the different timeframes are already a kind of indicator, the only indicator that I need, either in manual or automatic trading. Although, sometimes, I let myself tempted by a SMA 200 ! ;-)
ciremql4: as I said above my strategy is to open a trade on each breakout. No question on this point because the market is unpredictable. When the trade is opened, the decisions are taken based on the pattern which forms in different timeframes : keep the position or close it, as soon as possible. I call this the "post-breakout filter", may be this expression is not correct ...
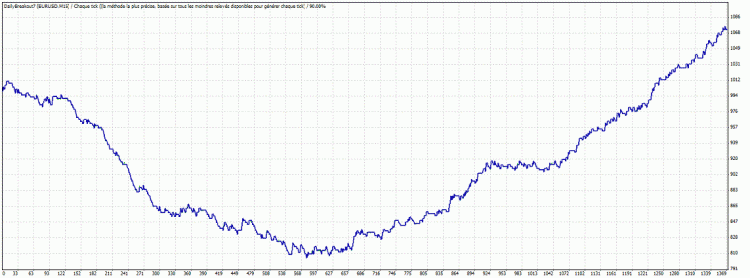
I ran a new test with a very, very simple strategy : daily breakout on EUR/USD with fixed SL (30), TP (60), breakeven (10) and volume (0.01). Here's what I get:
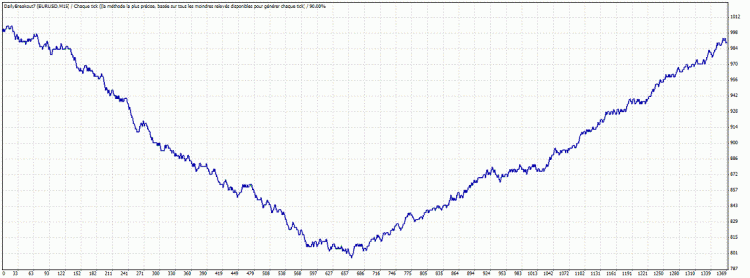
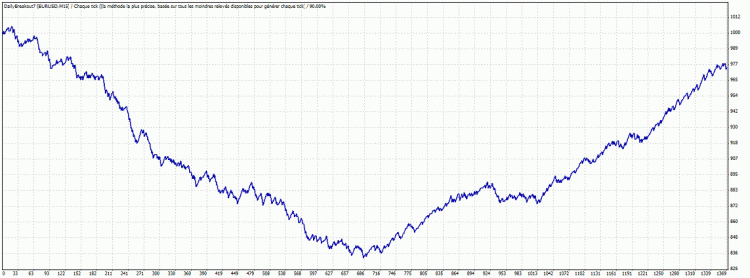
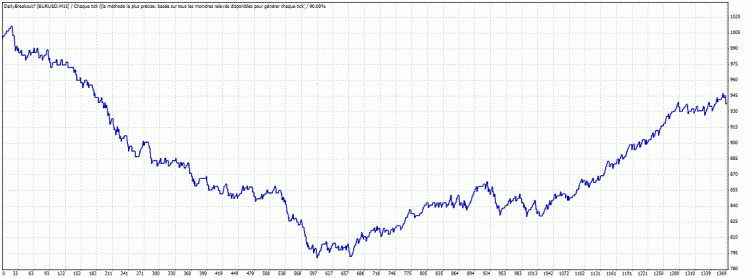
The same strategy with different TP and/or SL arround 10 or 30 pips :
(this one is perfect !)
Why 07/2007 ?!?
A full optimization is in progress just to check if it is possible to reverse the curve... but I have already tried to optimize this kind of strategy in the past, it has never been positive prior 07/2007.
Is it related to the market conditions on EUR/USD before and after 07/2007 and if so, is that such turbulence zone can happen again ? This is the question ...
Zoanku.
Thanks for your comments.
No indicator, only price action. In a sense, the candles taken in the different timeframes are already a kind of indicator, the only indicator that I need, either in manual or automatic trading. Although, sometimes, I let myself tempted by a SMA 200 ! ;-) <----- I assume yours are based on respective Price Levels, S/R,etc. Still, the same: Which PRICE did you use - High, Low, Close, Open, Median, etc, etc? How do you code this?
as I said above my strategy is to open a trade on each breakout. No question on this point because the market is unpredictable. When the trade is opened, the decisions are taken based on the pattern which forms in different timeframes .... <--- I suggest you don't consider any patterns logic first, just stick to Price Levels. Test/Optimize on Price Levels first; You can always include patterns later, once this is profitable. Step by step.
A full optimization is in progress just to check if it is possible to reverse the curve... but I have already tried to optimize this kind of strategy in the past, it has never been positive prior 07/2007.
Is it related to the market conditions on EUR/USD before and after 07/2007 and if so, is that such turbulence zone can happen again ? This is the question ...
Zoanku.
---->Optimization:
Its really pointless at this point if you do not know the root causes of what you are optimizing about, in the first place. You have to be specific. Just for your info, I was a fan of optimization, and still is, and had used 9-11 different set of 4 parameters. In a 5 year backtest, each of them was perfect, almost, with PF>10. But still my account didn't grow as expected. It DID help - but there is a limit, this my point.
----> Is it related to the market conditions on EUR/USD before and after 07/2007 and if so, is that such turbulence zone can happen again ? This is the question ...
This is almost "blaming the market".
I recalled, yes, the market was sawing thru levels after levels after levels. Then, I only managed to pull 1-3 pathetic scalp trade on the r in a day, and that too, manually. But, profits stalemated for only 3-4 months, if im not mistaken. My strategy is also Price Action-based on a 80-20 ratios.
What kind of "turbulent zone" are you referring to here?
- Free trading apps
- Over 8,000 signals for copying
- Economic news for exploring financial markets
You agree to website policy and terms of use


Hi guys,
It is an honor to write for the first time on this forum where I learned so much and where I hope to contribute soon.
I developed a very simple (and common) strategy based on the breakout of yesterday's range on EUR/USD. Since it is almost impossible to filter the breakout before they occur, I take each breakout. The goal of the strategy is to cut the trade as soon as possible if the breakout is too soft. Instead, I maximize the gain when the breakout is violent.
This post-breakout filter took me a lot of work (I don't use any breakeven) !
This strategy works perfectly in backtest since 2007, on my demo account since January 2011 and on my live account (micro) since June 2011. The performances are almost identical.
Below is a backtest over the period 2008 - today (PF = 2.52, Max DD = 7.8) :
I could be totally satisfied but I have a problem : the performances are disastrous before July 2007 as indicated in the graph below and I don't understand the reasons :
For weeks I analyzed the graphs in all directions, timeframes, ... I do not see any explanation. Why a simple breakout is different before and after July 2007?
- Is it a problem with MT4 tester ?
- Is it a problem of historical data ?
- Has volatility changed suddenly in 2007 ?
- Is it a question of volume ?
- Is it a matter of news ?
I have often seen this question here and there on the Internet, but never an explanation.
Maybe someone can enlighten me?
Thank you for your help (and sorry for my frenglish !).
Zoanku.