Discussion of article "MQL5 Cookbook: Writing the History of Deals to a File and Creating Balance Charts for Each Symbol in Excel"
As always a very competent approach to solving the problem. Well done, Anatoly, good article!
We should add that we should test without visual mode, because OnTester() has ... && !IsVisualMode().... Or remove this restriction so that the file is created during visualisation as well.
Quite an interesting result!
Is it possible to use it for optimisation - to collect a detailed report on trades for each pass and assign a serial number to it? And, is it possible to do all this for MT4?
Quite an interesting result!
Is it possible to use it for optimisation - to collect a detailed report on trades for each pass and assign a serial number to it? And, is it possible to do all this for MT4?
Check out this article: Visualise a strategy in MetaTrader 5 Tester >>>>
There is no such possibility for MT4, using MQL tools (as far as I know).
Quite an interesting result!
Is it possible to use it for optimisation - to collect a detailed report on trades for each pass and assign a serial number to it? And, is it possible to do all this for MT4?
As for the processing of optimisation results, judging by the code from the article, you only need to remove the !IsOptimization() check from OnTester and take into account some changing parameter (or just the run number) in the generation of the file name, for example, see "Working with Optimisation Results". Working with optimisation results.
I made a similar thing in JavaScript, and I watch it in the browser, loading test reports (html-files). Accordingly, my approach doesn't work from the optimiser. But without Excel.
Check out this article: Visualise your strategy in MetaTrader 5 Tester >>>
For MT4, with MQL (as far as I know), there is no such possibility.
I have already studied this article - thank you. I have somewhat more complicated criteria for selecting test results, taking into account the peculiarities of the strategy, and I am still on MT4...
Apparently the only way out is to make two programs (Expert Advisor) for MT4 and MT5, one for work and one for optimisation....
As for the processing of optimisation results, judging by the code from the article, you only need to remove the !IsOptimization() check from OnTester and take into account in the generation of the file name some changing parameter (or just the number of runs), for example, see "Working with Optimisation Results. Working with optimisation results.
I made a similar thing in JavaScript, and I watch it in the browser, loading test reports (html-files). Accordingly, my approach does not work from the optimiser. But without excel.
I will be aware of the possibility - thank you.
Can you tell me more about your JavaScript thingy? What can it do?
I have already studied this article - thank you. I have somewhat more complicated criteria for selecting test results, taking into account the peculiarities of the strategy, and on MT4 I am still...
...
What prevents you from applying your own criteria for selection using the method proposed in that article? There are no restrictions at all, as all series of trades of each optimisation pass are available.
- Free trading apps
- Over 8,000 signals for copying
- Economic news for exploring financial markets
You agree to website policy and terms of use


New article MQL5 Cookbook: Writing the History of Deals to a File and Creating Balance Charts for Each Symbol in Excel has been published:
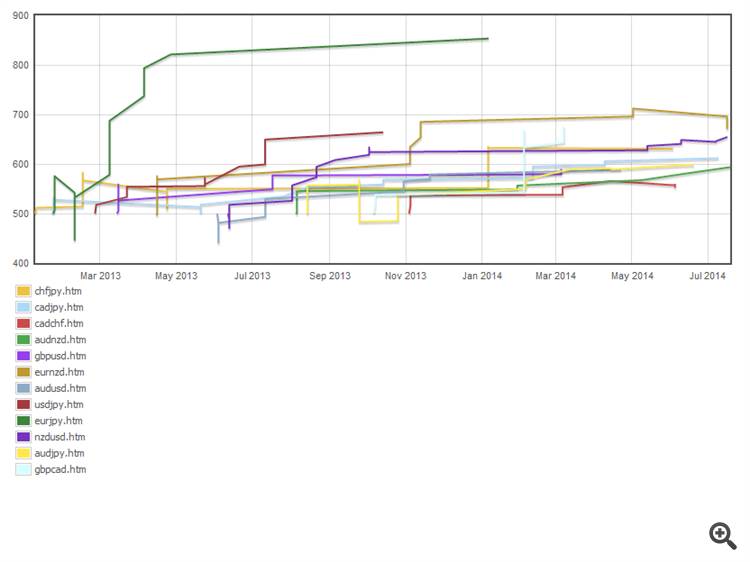
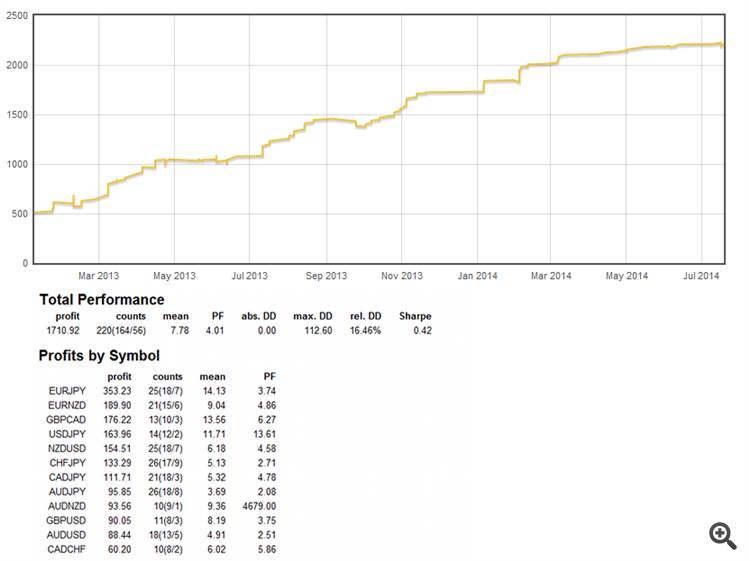
When communicating in various forums, I often used examples of my test results displayed as screenshots of Microsoft Excel charts. I have many times been asked to explain how such charts can be created. Excel offers ample features for creating charts and there are lots of books on that subject. To find the required information in a book, one may have to read it all. Now finally, I have some time to explain it all in this article.
So today I will show you a simple method of how you can get balance charts for all the symbols along with the cumulative result of a multi-currency Expert Advisor on a single Excel diagram with just a couple of clicks. To reconstruct the example, we will take the multi-currency Expert Advisor from the previous article. It will be enhanced with a function that will write the history of deals and balance curves for all symbols to a .csv file upon completion of the test. Moreover, we will add another column to the report to show drawdowns from all local maxima.
Let's create an Excel book set up so as to be able to connect the data file. The book can be opened all the time, so it will not need to be closed before running another test. Upon completion of the test, you will only need to refresh the data by pressing a certain key to be able to see the changes in the report and on the chart.
Author: Anatoli Kazharski