Need Help On Optimization Result - page 2
You are missing trading opportunities:
- Free trading apps
- Over 8,000 signals for copying
- Economic news for exploring financial markets
Registration
Log in
You agree to website policy and terms of use
If you do not have an account, please register
I'm trying to understand the origin of your x and P(x) numbers, I think maybe english is not your first language so I want to make sure we understand the meaning of the terms you are using before I make any conclusions or confusing statements.
"with a constant risk of 0.5% per trade"
What is 0.5% risk per trade? Does this mean you are risking 0.5% of the account balance in the event that the market moves against your position and the position is closed at the stoploss price?
"that means I have a 0.35% of being at 50% of my account balance"
Risk of ruin is a time-factor computation, meaning the units on the statement that you make with the numbers you compute is intended to be a "per trade" or "per week" or "per month".
At the moment I can't tell where x and P(x) come from but that determines the units involved here.
Help me understand what you did and I'll be more than happy to invest the time to determine if you are applying the calculations correctly.
hi philip
and thanks for helping me out here :)
0.5% risk per trade means exactly that . Is the amount I lose if the market moves against my position and reaches SL.
The 0.35% value Is for the period of the whole test ( which is a period of about 8 years.... ), X and P(X) both taken form this report as well.
I can't really figure out for what period of time will it be logical to make this computation !
lets take the period from 10.01.2001 - 10.01.2002
Will it be logical to compute the factor on that period ?? Is there enough data here to determine the relationship between winning and losing trades... ?
hope I was clear this time :)
The way you use risk of ruin calcs is you define a time period (monthly, weekly, yearly, etc), or an increment of some kind (per trade, per 10 trades, etc), and then you assemble the statistics for those periods. It matters in terms of what the resulting output of the risk of ruin calc actually means (its units).
Sometimes it helps to first focus on making sure you are asking the right question (in other words make sure the answer you are trying to compute is actually going to answer the question you need/want answered).
For example, my client's operate on a monthly timeline. They don't care about the daily or weekly stuff, for them its all about the monthly results. So in my case it does no one any good for me to compute risk of ruin for weekly results or on a per-trade basis.
As such, what I must do in the backtest is capture the average rate of return (profits, losses, ROR, etc) on a monthly basis. Something like the following:
To compute risk of ruin metrics you must first assemble the data for your time frame. In my case in this example I needed to assemble the monthly rate of return results, compute the average monthly ROR and then compute the standard deviation of those monthly rates of returns.
In this example the average monthyl ROR was 12% with a standard deviation of 8%...from the backtesting results this should have been golden going forward, only it wasn't (as you can see). Note I refer to risk of ruin as risk of loss (ROL) as I'm not interested in knowing when my account will be ruined (that is the trivial question) but rather I am more interested in knowing how frequently I ought to expect the account to be underwater by some fixed amount, say 20%.
So a 12% monthyl ROR with an 8% standard deviation means I can expect my account to experience a 7.4% loss in account value around 6.5% of the time (6.5% of the end of month events, or about once every 15 months).
So while I was initially caught off-guard by the seemingly inexplicable forward test result, it was perfectly reasonable to expect such a monthly result based on the backtesting results, once very 15 months I can expect such a negative drawdown on my account's highwater mark.
So you see, in order for you to compute a meaningful risk of loss assessment you must first decide what time period is pertinent to you and then you must assemble the results in a form that are amenable to computing the average and standard deviation of the RoR in that time period.
Once you have that data from the backtest you can then perform a myriad of statistical-based analyses using risk of ruin (or risk of loss as I like to refer to it) calcs.
I have a lot of questions !!
for starters....
1- In your monthly computations do you assume constant position size ?
2- Is each monthly test done on the initial deposit ? regardless of progress of the previous months ?
assuming the answer to the first two questions is YES :)
I computed ROR for 14 groups of 100 trades
I used 0.01 lot size and made the computation on the initial deposit of $700 for each group
and got the following results :
(I need to install excell don't I ... ? )
1-> 0%
2-> + 12%
3-> 0%
4-> + 18%
5-> - 3%
6-> -8%
7-> +22%
8-> -3%
9-> +11%
10-> +23%
11-> +17%
12-> +7%
13-> -8%
14-> +2%
from this data I've got an average ROR of 6.5% with a standard deviation of 10.47%
Now im not sure how to calculate the second part :
"So a 12% monthyl ROR with an 8% standard deviation means I can expect my account to experience a 7.4% loss in account value around 6.5% of the time (6.5% of the end of month events, or about once every 15 months)."
I have a lot of questions !!
for starters....
1- In your monthly computations do you assume constant position size ?
2- Is each monthly test done on the initial deposit ? regardless of progress of the previous months ?
Yes, backtesting MUST always be done without compounding in effect if you wish to remove event chronology biasing from the analysis. We must place each event (trade) on equal weighting as every other event if we intend to employ non-weighted statistical analyses (such as taking the average and the standard deviation and so on). I suspect you are aware of this already.
When forward testing/live testing then you must make a choice - do you want the forward test to be all about making money (compounding ought to be in effect then) or do you want the forward test to further generate data that are amenable to these types of statistical analyses?
I should note that in the mathematical limit of the sampling period becoming small enough as to capture one trade that the statistical biasing factors go to unity (one), so the errors introduced by ignoring the fact that stat biasing is in effect can be minimal in those situations.
The point of all this gibberish is to say that you have decisions to make, both in regards to your backtests as well as your forward tests (or live trading) and if you wish for the statistics between the two to be comparable in a mathematical sense then you need to make sure you have managed the backtest in such a way that makes the resultant data amenable to mapping (another mathematical term) to the relevant statistics for the forward tests.
Doing the backtests with fixed lotsize invariant to the starting account balance is the only way to to do in the backtest.
assuming the answer to the first two questions is YES :)
I computed ROR for 14 groups of 100 trades
I used 0.01 lot size and made the computation on the initial deposit of $700 for each group
and got the following results :
(I need to install excell don't I ... ? )
1-> 0%
2-> + 12%
3-> 0%
4-> + 18%
5-> - 3%
6-> -8%
7-> +22%
8-> -3%
9-> +11%
10-> +23%
11-> +17%
12-> +7%
13-> -8%
14-> +2%
from this data I've got an average ROR of 6.5% with a standard deviation of 10.47%
Now im not sure how to calculate the second part :
"So a 12% monthyl ROR with an 8% standard deviation means I can expect my account to experience a 7.4% loss in account value around 6.5% of the time (6.5% of the end of month events, or about once every 15 months)."
Once you have your data from the backtest, and provided the data are prepared as discussed in the post above, you can choose which equation you wish to use for computing your future risk of loss.
Will you be using compounding or not? If you are NOT intending to use compounding then the equation is simple, as follows:
And so we compute your R (the frequency for which you can expect your account to be down by 10% after 100 trades) as:
So in this example, the question being "how frequently can I expect my account to experience at least a 10% drawdown from the high-water mark after 100 trades?" the answer is "30.5% of the time this will happen".
Or to turn it around, you could say "my account should be down by 10% off its high-water mark at least once every three 100-trade periods". That is if you don't do compounding.
If you intend to do compounding in your account for forward testing or live testing then you use the same RoR% and stand-dev (since you generated them with no event chronology biaising, they can be mapped to this use as well) then you simply use the more complicated forumula:
And so we compute R for a compounding trade method that is built upon a trade strategy as you have developed and we get:
In this case, the difference between compounding or not compounding makes little difference to the computed risk of loss (30.6% vs 30.5%), as expected, but compounding will always perform worse than not compounding (statistically at least) if your Sharpe Ratio is <1. (yours is 0.62, well below 1)
I'm not sure we're on the same page here ...
the formulas are quite familiar...
however does it really make sense to have a 30.5% chance to lose atleast 10% of the account balance for the distribution of values in hand ??
consider the fact that for this set of 14 values the maximum drawdown was 8% which repeated itself only twice and never below !
so the 30.5% to have a drawdown of 10%+ seems quite out of proportion here...
I made my own little research and tried to compute the chance of having a drawdown of 10%+ and got a different result
I used the following formula :
X is a random variable from a normal distribution with mean μ and standard deviation σ
X = - 10%
µ = 6.5%
σ = 10.47%
because of the symmetric nature of normal distribution I can use + 1.576
The cumulative probability up to Z is given by -> Φ(t)=P(Z≤t)
but I need to calculate the Complementary cumulative which is 1-Φ(t) = 1 - P(1.576) = 1 - 0.9418 = 0.0582 = 5.8%does it make any sense ?? are we talking about the same thing ?
X is a random variable from a normal distribution with mean μ and standard deviation σ
X = - 10%
µ = 6.5%
σ = 10.47%
but I need to calculate the Complementary cumulative which is 1-Φ(t) = 1 - P(1.576) = 1 - 0.9418 = 0.0582 = 5.8%does it make any sense ?? are we talking about the same thing ?
Is µ here the average drawdown or is it the average rate of return? And is σ here the standard deviation of the drawdown or is it the standard deviation of the RoR? Is the complementary cumulative the probability of a 10% drawdown or the probability of a -10% rate of return?
As I understand it, you are conflating your risk of returns values with those of risk of drawdown. If you want to compute the statistics of risk of drawdown then you need to compute the drawdown for every trade (not the profit/loss, but transient drawdown while trade was "live") such that you can then compute the average drawdown per trade and the stddev, then the complementary cumulative value will represent what you are thinking about.
We are talking about risk of ruin (specifically risk of loss, an even more generalized case of the risk of ruin calculation). Checkout this article, I mean really read it and not just gloss over the specific nuance of the words employed.
On page two we have the very simple calculation for computing risk of losing 1-sigma, your sigma is 10.47%. The risk of losing 10.47% is dependent on your average rate of return, which is 6.5% for your case. Your sharpe is below 1 (usually not considered a good thing) and your risk of losing 10.47% (1-sigma) is 29.1%.
Take note of the ordinate and abscissa for this graph, people get tripped up by this all the time. The y-axis should inspire a few key questions in your mind, and answering them will lead you down the path of understanding what drawdown means. Ask yourself "how is it that I have a near 100% probability of incurring a 0.1% loss?".
Think about it, think about what it is we are computing with risk of loss/ruin, think about what your trade's equity vs. time graph looks like and realize that every time it sets a new high and then pulls back ever so slightly that this ever so slight pullback is a drawdown from the newly set high-water mark.
At any rate, people don't tend to contemplate risk of loss with respect to 1-sigma, they do tend to think in terms of 50/50 like a coin toss. So what is the amount of equity your account stands to lose 50% of the time? Answer: 6%
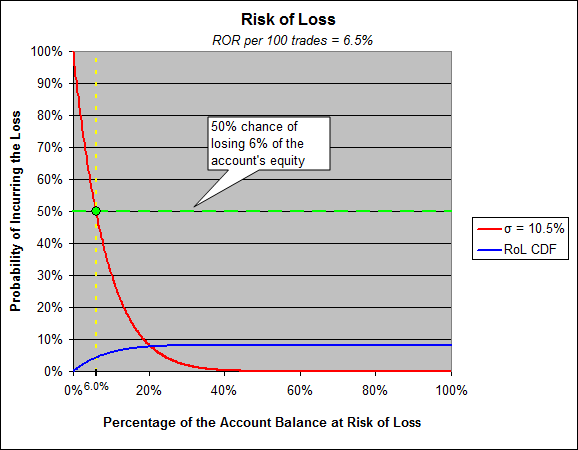
You have a 50/50 chance of losing 6% by then end of any given round of 100-trades.
Also understand this calculation is based on the statistics of merely 14 samples, generally we refer to the numbers produced by these calculations as "lower limits". Meaning while we compute that you stand to lose 6% of your account equity 50% of the time we also take that value to really mean "at least 6%, but likely higher owing to unaccounted risk factors".
There is a reason 75% of people lose money in forex despite having backtests showing their strategy is the holy grail. The data are at their disposal (that is to say they could generate the data as needed) to compute the risk of ruin, but they get sold on the hope and dreams that is profit factor and expected payoff, etc.
Don't take my word for it though, you've got the article, hit up David and ask away, he likes to talk about it. And put it to the test. Take your backtested strategy and put it into a forward test and watch what happens. (did you look at my results above when I unwittingly ran this experiment myself?)
(and there is another nugget of financial epiphany to be discovered in risk of loss analyses, you will discover why the Sharpe Ratio is so venerated among financial analysts and then you will come to realize its primary weakness and why people say "beta kills")
OK
I think I got this . thanks
be back with more questions tomorrow :)
Oh ...
There is one thing I still don't understand.... aren't there any other factors influencing this calculation ??
Lets take your ROR results computed on a monthly basis
Lets assume (for the sake of argument) that the more trades there are in a month the higher the ROR you get
for example : for 0 trades you earn 0%
for 10 trades you make 5% ( on average)
for 20 trades you make 10% (on average)
and so on...
lets assume in for that period of 30 months there was a high spread of values in the ROR distribution ( for each month there was a completely different number of trades made )
so that the mean return is 10% and the standard deviation is 20% and there were no negative ROR ( you can't have a negative number of trades... )
now the computation of the risk of loss of one standard deviation which is 20% will give us approximetly 37% ... which doesn't really make any sense..
Do you see where im going here ?