See Indicators in Backtest
Hey, is there a way I can show my indicators -during- the backtest, because they don't show up until after the test is complete.
I'd like to see the moving average, or MACD in real time as I'm watching the backtest unfold, so I can actually see if my EA is placing orders in the right spots...
dude, stop the back test, and then apply a template .....
What I mean is, if I use Visual mode in the Strategy Tester, it does not show the Indicators in real time, it waits for the backtest to complete then draws all the indicator lines on the Chart.. I want to see the lines drawn as the Strategy Tester is running, just like in live trading..
But I want to see the indicators my EA is using..... My EA uses a MA and MACD and SAR, I want it to display all these indicators, without having to drag each of them one-by-one into the chart with the correct settings....
u have no choice
But I want to see the indicators my EA is using..... My EA uses a MA and MACD and SAR, I want it to display all these indicators, without having to drag each of them one-by-one into the chart with the correct settings....
Attach them to the chart. Save as a template.
I tried this, but:
// --- PLOT INDICATOR ON CHART WHEN TESTING ---------------------------------------------------------------
void PlotIndicatorWhenTesting()
  {
   double customI=iCustom(NULL,0,"Chi Pivot Dark",0,0,0);
  }
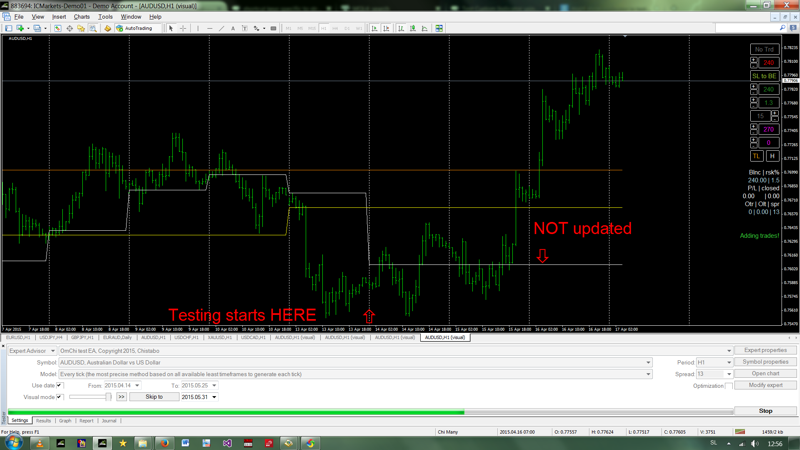
is not updating while visually back-testing. When I click 'Stop' (visual testing), indicator appears on chart, correctly.
So to back-test this half-manual strategy, currently only option is to delete-and-attach-again labor for indicator to update (once a day). In this case I don't even need to put indicator into EA.
I want indicator to update AND show on chart while EA is running. Checked world-wide-web, no luck. Please help with this issue.
Best regards,
Simon
S love nia
Indicator code:
//+------------------------------------------------------------------+
//|                                              Chi Pivot Indic.mq4 |
//|                                         Copyright 2015, Chistabo |
//|                                               chistabo@gmail.com |
//+------------------------------------------------------------------+
#property copyright "Copyright 2015, Chistabo"
#property link      "chistabo@gmail.com"
#property version   "1.00"
#property strict
#property indicator_chart_window
#property indicator_buffers 3
#property indicator_color1 C'45,45,45' // I use black chart background,
#property indicator_color2 C'30,30,30' // those lines are barely visible
#property indicator_color3 C'25,25,25'
double P1Buffer[];
double P2Buffer[];
double P3Buffer[];
double PP,Q;
//+------------------------------------------------------------------+
//| Custom indicator initialization function                         |
//+------------------------------------------------------------------+
int OnInit()
  {
   SetIndexBuffer(0,P1Buffer);
   SetIndexBuffer(1,P2Buffer);
   SetIndexBuffer(2,P3Buffer);
   SetIndexStyle(0,DRAW_LINE,STYLE_SOLID,1);
   SetIndexStyle(1,DRAW_LINE,STYLE_SOLID,1);
   SetIndexStyle(2,DRAW_LINE,STYLE_SOLID,1);
   return(INIT_SUCCEEDED);
  }
//+------------------------------------------------------------------+
//| Custom indicator iteration function                              |
//+------------------------------------------------------------------+
int OnCalculate(const int rates_total,const int prev_calculated,const datetime &time[],const double &open[],const double &high[],
                const double &low[],const double &close[],const long &tick_volume[],const long &volume[],const int &spread[])
  {
   int i,dayi,counted_bars=IndicatorCounted();
   if(counted_bars<0)
      return(-1);
   if(counted_bars>0)
      counted_bars--;
   int limit=Bars-counted_bars;
   for(i=limit-1; i>=0; i--)
     {
      dayi=iBarShift(Symbol(),PERIOD_D1,Time[i],false);
      Q=(iHigh(Symbol(),PERIOD_D1,dayi+1)-iLow(Symbol(),PERIOD_D1,dayi+1));
      PP=(iHigh(Symbol(),PERIOD_D1,dayi+1)+iLow(Symbol(),PERIOD_D1,dayi+1)+iClose(Symbol(),PERIOD_D1,dayi+1))/3;
      P1Buffer[i]=PP;

      dayi=iBarShift(Symbol(),PERIOD_W1,Time[i],false);
      Q=(iHigh(Symbol(),PERIOD_W1,dayi+1)-iLow(Symbol(),PERIOD_W1,dayi+1));
      PP=(iHigh(Symbol(),PERIOD_W1,dayi+1)+iLow(Symbol(),PERIOD_W1,dayi+1)+iClose(Symbol(),PERIOD_W1,dayi+1))/3;
      P2Buffer[i]=PP;

      dayi=iBarShift(Symbol(),PERIOD_MN1,Time[i],false);
      Q=(iHigh(Symbol(),PERIOD_MN1,dayi+1)-iLow(Symbol(),PERIOD_MN1,dayi+1));
      PP=(iHigh(Symbol(),PERIOD_MN1,dayi+1)+iLow(Symbol(),PERIOD_MN1,dayi+1)+iClose(Symbol(),PERIOD_MN1,dayi+1))/3;
      P3Buffer[i]=PP;
     }   return(rates_total);
  }
//+------------------------------------------------------------------+
Code in EA:
// --- extern variable

extern bool bPlotIndicatorWhenTesting=false; // Plot indicator (Chi Pivot Indic) when testing?

// --- OnTick function in EA

   if(IsTesting() && bPlotIndicatorWhenTesting)PlotIndicatorWhenTesting();

// --- custom function

// --- PLOT INDICATOR ON CHART WHEN TESTING ---------------------------------------------------------------
void PlotIndicatorWhenTesting() // https://forum.mql4.com/36488
  {
   double customI=iCustom(NULL,0,"Chi Pivot Indic",0,0,0); // this would 'plot' SetIndexBuffer(0,P1Buffer);
  }
//+------------------------------------------------------------------+
Thank you for your help.
Best regards,
Simon
S love nia
Here are screenshots:
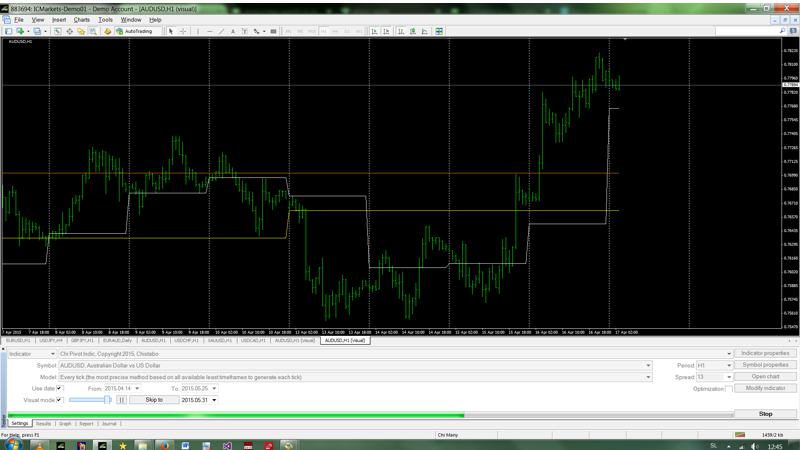
Testing Indicator - works OK
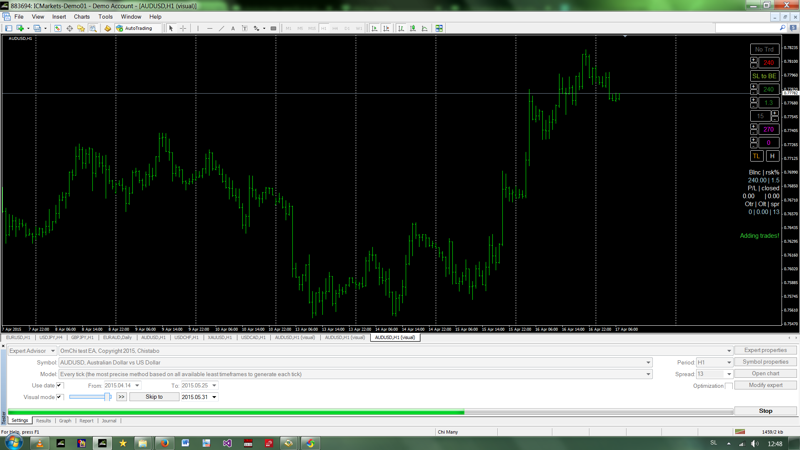
Testing EA - before [Stop] (testing) is pressed
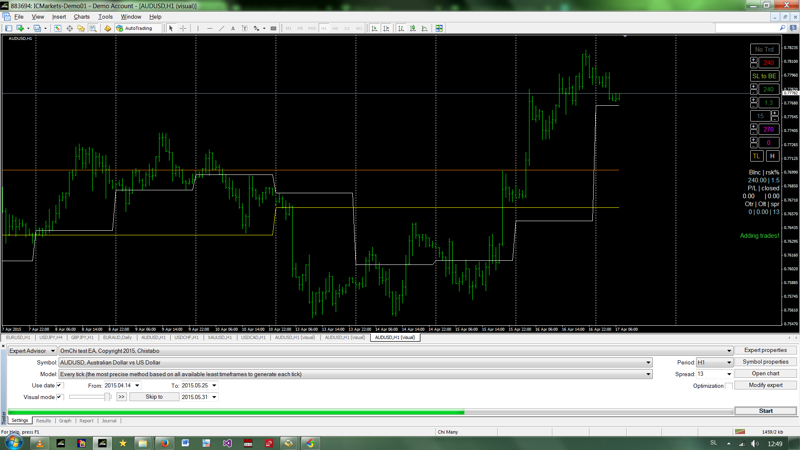
Testing EA - after [Stop] (testing) is pressed - indic works correctly
Testing EA - indicator is attached to chart (via Insert -> Indicators -> Custom -> Chi Pivot Indic
How can we solve this? (Yea, I know, there is no WE - lol.)
Simon
S love nia
- Free trading apps
- Over 8,000 signals for copying
- Economic news for exploring financial markets
You agree to website policy and terms of use
Hey, is there a way I can show my indicators -during- the backtest, because they don't show up until after the test is complete.
I'd like to see the moving average, or MACD in real time as I'm watching the backtest unfold, so I can actually see if my EA is placing orders in the right spots...