Statistics : Collecting Hourly Average Range

 
//+------------------------------------------------------------------+
//|                                                           doshur |
//|                                                   www.doshur.com |
//+------------------------------------------------------------------+
#property copyright "doshur"
#property link      "www.doshur.com"

double PTs[24, 2];

#property indicator_separate_window
#property indicator_minimum 0
#property indicator_maximum 1
//+------------------------------------------------------------------+
//| Custom indicator initialization function                         |
//+------------------------------------------------------------------+
int init()
  {
//----
//----
   return(0);
  }
//+------------------------------------------------------------------+
//| Custom indicator deinitialization function                       |
//+------------------------------------------------------------------+
int deinit()
  {
//----
//----
   return(0);
  }
//+------------------------------------------------------------------+
//| Custom indicator iteration function                              |
//+------------------------------------------------------------------+
int start()
  {
//----

   int i, x;

   for(i = 1; i < 24 * 20; i++)
   {
      x = TimeHour(iTime(NULL, PERIOD_H1, i));
      PTs[x, 0] += iHigh(NULL, PERIOD_H1, i) - iLow(NULL, PERIOD_H1, i);
      PTs[x, 1]++;
   }

   for(i = 0; i < 24; i++)
   {
      Print(i, " - ", PTs[i, 0] / PTs[i, 1]);
   }

   for(i = 0; i < 24; i++)
   {
      PTs[i, 0] = 0;
      PTs[i, 1] = 0;
   }

//----
   return(0);
  }

Hi All,

Anyone had better suggestion about how to collect hourly range statistics?

Regards 


hi, i assume you want collect statistics of the last 20 days.

you should consider that on weekend there is a gap. so your statistics get falsified.

i suggest something like:

double hourbuffer[20][24];
loops:::::
 hourbuffer[day][TimeHour(Time[x])]=   DATA
 

Hi,

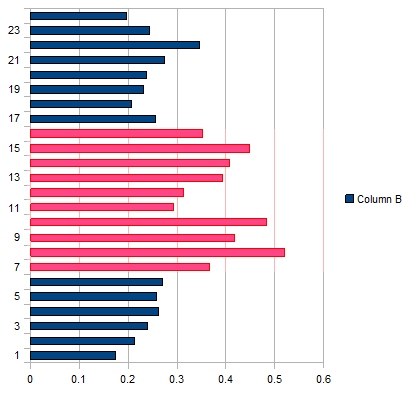
I'm actually trying to get average hourly range to determine which hours are very active and which are not and employ different strategies

Anyone can code this into a script and export into excel? 


This is the data that I have have manually key into openoffice and generate a chart

highlighted are times of high activity

looking to see if anyone can help to code this into script and export the data directly into excel 


Hi

I need help on how to write MT 4 formula for MS Excel worksheet in multiple time-frames to be able to see what a currency pair has done in the last 12 hours, 24 hours, last week and month in the for of heat-map visually just like it is presented on this website http://finviz.com/forex_performance.ashx so that you know the strength and weakness of different pairs over a period of time, be able to know which one is trending, consolidating and stall.

Thanks.

Reason: