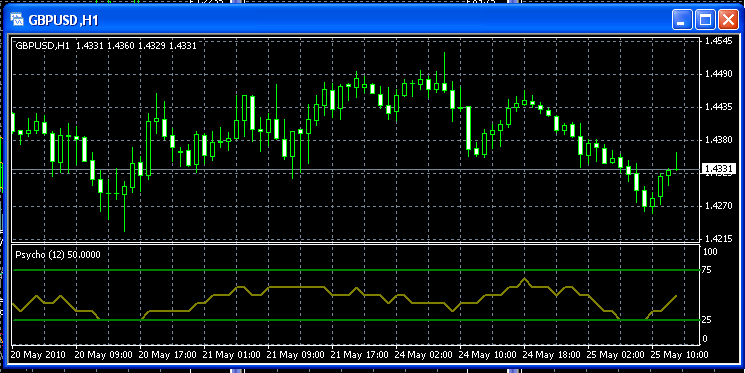
here's indicator part (only drawing line, no alerts, live trading or whatever):
//+------------------------------------------------------------------+
//|                                                           Psycho |
//+------------------------------------------------------------------+

#property indicator_separate_window
#property indicator_buffers 1
#property indicator_minimum 0
#property indicator_maximum 100
#property indicator_color1 Olive

extern int PsychoPeriod=12;

double Psycho[];


//+------------------------------------------------------------------+
//| Custom indicator initialization function                         |
//+------------------------------------------------------------------+

int init()
 {
 SetIndexBuffer(0,Psycho);
 IndicatorShortName("Psycho ("+PsychoPeriod+")");
 SetIndexStyle(0,0,EMPTY,2);
 SetIndexLabel(0,"Psycho");
 SetLevelStyle(0,2,Green);
 SetLevelStyle(1,2,Green);
 SetLevelValue(0,25);
 SetLevelValue(1,75);
 return(0);
 }

//+------------------------------------------------------------------+
//| Custom indicator deinitialization function                       |
//+------------------------------------------------------------------+
int deinit()
  {
  return(0);
  }
//+------------------------------------------------------------------+
//| Custom indicator iteration function                              |
//+------------------------------------------------------------------+
int start()
 {

 int limit;
 int counted_bars=IndicatorCounted();
 if(counted_bars>0) counted_bars--;
 limit=Bars-counted_bars;


for(int i=0;i<limit;i++)
 {
 double UpBarCount=0;
 for(int j=0;j<PsychoPeriod;j++)
  {
  if(Close[i+j]>Close[i+j+1]) UpBarCount++;
  }
 Psycho[i]=100*UpBarCount/PsychoPeriod;
 }

 return(0);
 }
//+------------------------------------------------------------------+

I'd like to note two things however:
- such simple things may work only in slow ranging market; you'll probably need some sort of filter;
- this indicator is somewhat asymmetric, as it counts up bars against sum of down and no change bars; this doesn't matter much on H1 and bigger timeframes as 'no change' rarely happens there, but on short timeframes there will be considerable and unsubstantiated downward bias.
additional disclaimer :)
I'm pretty much a n00b in MQL4, and probably something could be done more efficiently. for example, UpBarCount should really be int, but it's double to work around rounding because of type casting; there's surely a way to do that otherwise.
nevertheless, this works.
Hello Drave,
thanks for you work :)
Best Regards
blauhund2003
- Free trading apps
- Over 8,000 signals for copying
- Economic news for exploring financial markets
You agree to website policy and terms of use
Hi @ all,
i have for my Avatrader a very good Indicator to generate Buy and Sell Signals .
Look at this link: http://www.actfx.com/Download50081.aspx
But i need this Indicator for my MT4. Please can someone program it for MT4 ?
This is the code for the Avatrader (.act):
___________________________________________________
ConstIndicatorName = 'Psychological Line_final 2';
Layout = Separated;
var
Psyho: TLineGraph;
period, i: Integer;
psy1: real;
instr, time_int: string;
LinesColor: TColor;
procedure CreateSettings;
begin
AddSetting('candle_period', 'Number of candles', '12');
AddSetting('instrmnt', 'Instrument', '');
AddSetting('time_interval', 'Time interval', '');
AddSetting('color', 'Color', 'clBlue');
AddSetting('linescolor', 'Lines Color', 'clYellow');
end;
procedure ApplySettings;
begin
Period := StrToInt(GetSetting('candle_period'));
Psyho.Color := StrToColor(GetSetting('color'));
LinesColor := StrToColor(GetSetting('linescolor'));
SetTitle('Psychological Line: period = ' + GetSetting('candle_period'));
Instr:=GetSetting('instrmnt');
time_int:=GetSetting('time_interval');
end;
procedure Init;
begin
Psyho := TLineGraph.Create();
SetYScale(0,100);
end;
procedure Recalculate;
var
i: Integer;
begin
Psyho.Clear;
for i := 0 to SourceGraph.Count - 1 do
begin
Add(i);
end;
end; // Recalculate
function Psy(ValueIndex:Integer):double;
var i:integer;
Ind:integer;
begin
Ind:=0;
for i:=1 to (period) do if SourceGraph.CloseValue(ValueIndex-i)>SourceGraph.CloseValue(ValueIndex-i-1) then Ind:=Ind+1;
result:=(Ind/period)*100;
end;
procedure Add(const ValueIndex: Integer);
var LastTime: TDateTime;
begin
Psyho.AddXY(SourceGraph.XValue(ValueIndex)-1, Psy(ValueIndex));
if ValueIndex > SourceGraph.Count-2 then
begin
if (Psy(ValueIndex)>=75) and (Psy(ValueIndex-1)<75) and (SourceGraph.DateTime(ValueIndex)<>LastTime) then
begin
PlaySound('PriceAlert.wav');
ShowMessage('Maybe it is time to sell ' + instr + '. See ' + time_int + ' chart');
LastTime := SourceGraph.DateTime(ValueIndex);
end;
if (Psy(ValueIndex)<=25) and (Psy(ValueIndex-1)>25) and (SourceGraph.DateTime(ValueIndex)<>LastTime) then
begin
PlaySound('PriceAlert.wav');
ShowMessage('Maybe it is time to buy ' + instr + '. See ' + time_int + ' chart');
LastTime := SourceGraph.DateTime(ValueIndex);
end;
end;
end;
procedure Draw;
var
Height, Y: Integer;
begin
Height := Bottom - Top;
Canvas.Pen.Color := LinesColor;
Y := Bottom - Round(0.25 * Height);
Canvas.Line(Left, Y, Right, Y);
Y := Bottom - Round(0.75 * Height);
Canvas.Line(Left, Y, Right, Y);
end;
_________________________________________________________
Thanks for your help !
Best Regards
blauhund2003