Hi all,
I have been looking for a normalised version of the momentum indicator and cannot find exactly what I'm after.
I am now looking into changing the momentum indicator to display values from 0-100 (is this called normalised?) like RSI. Can anyone give me some example code of what would needed to be done to make the momentum indicator show values inside 0-100? Any hints would be appreciated.
Just re-iterate,
I think what I'm trying to do is 'quantize' the momentum values to 0-100 so that the signal appears the same visually but returns values between 0-100 instead of continuous values.
Because momentum has no theoretical upper limit or “ceiling” value, it will; be necessary to make a few compromises in order to normalize it.
One fairly basic approach is to determine the standard deviation of the historical momentum values over say the last 30 time periods or more. You can then set your maximum limit at say +/- 2 standard deviations. (stddev2) and if any momentum value exceeds this limit just clip it to the limit value.
i.e.
if (momentum > stddev2)
momentum = stddev2
if momentum < -stddev2
momentum = -stddev2
The normalized momentum then becomes (momentum/stddev2)*100 to give you a normalized momentum range of +/- 100.
The momentum value can also have a wide dynamic range so before normalizing it you may want to compress the data by passing the raw momentum value through a non linear function such as a log function.
The algorithm for standard deviation is readily available and I think I have even seen some examples somewhere in the metatrader code base.
There are various other ways of going about normalizing. The best approach will depend very much on what your end objective is.
I don’t have any ready to go code to hand but I hope this info is of some help.
Regards
Tim Wilson
Thanks for that Tim, very useful info.
Ultimatley I want to have a new indicator that displays exactly the same as momentum currently does but instead returns 0-100 values from low to high in the indicator box.
I was thinking of counting back 200 momentum bars and recording the lowest value as 0 and the highest value as 100 and then plotting the values inbetween based on those points as min-max. Is this doable?
I was thinking of counting back 200 momentum bars and recording the lowest value as 0 and the highest value as 100 and then plotting the values inbetween based on those points as min-max. Is this doable?
yes, its possible.
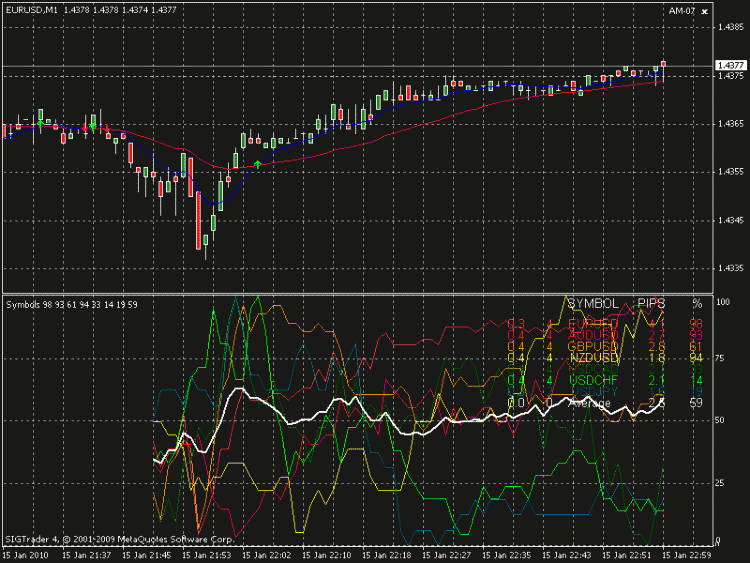
i have made an indicator which displays 7 different symbols in an indicator window, all values between 0 and 100 percent, based on the last x bars high/low-values.
no problem to do this...
yes, its possible.
i have made an indicator which displays 7 different symbols in an indicator window, all values between 0 and 100 percent, based on the last x bars high/low-values.
no problem to do this...
Thanks Meikel,
I can count back and return the minimum and maximum values ok, could you give me an example of how you would do the math to plot the prices between the min and max? (0-100)

#property  indicator_separate_window
#property  indicator_buffers 1
#property  indicator_color1  Red
#property indicator_minimum 0
#property indicator_maximum 100
#property indicator_level3 50
#property indicator_level4 32
#property indicator_level5 68


extern int QUANTIZE_PERIOD=400;
extern int MOMENTUM_PERIOD=11;


double     MOMENTUM_Buffer[];

double momentumValue;
double momentumNow;
double currentMomentum_30mMin=100;
double currentMomentum_30mMax=0;

//+------------------------------------------------------------------+
//| Custom indicator initialization function                         |
//+------------------------------------------------------------------+
int init()
  {


   SetIndexStyle(0,DRAW_LINE);
   SetIndexBuffer(0,MOMENTUM_Buffer);
   SetIndexDrawBegin(0,QUANTIZE_PERIOD+MOMENTUM_PERIOD);
   IndicatorDigits(Digits+1);
   IndicatorShortName("Q_MOMENTUM("+QUANTIZE_PERIOD+","+MOMENTUM_PERIOD+")");
   SetIndexLabel(0,"Q_MOMENTUM");
   SetLevelValue(1,100);

   return(0);
  }

int start()
  {
   int limit;
   int counted_bars=IndicatorCounted();

   if(counted_bars>0) counted_bars--;
   limit=Bars-counted_bars;


   // loop through previous x Bars
  for (int i = 0; i < QUANTIZE_PERIOD; i ++)
    {
      momentumValue = iMomentum(NULL, 0, MOMENTUM_PERIOD, PRICE_CLOSE,i);
      momentumNow = iMomentum(NULL, 0, MOMENTUM_PERIOD, PRICE_CLOSE, 0);

      // check Min
      if (momentumValue < currentMomentum_30mMin)
      {
         currentMomentum_30mMin = momentumValue;
      }

      // check Max
      if (momentumValue > currentMomentum_30mMax)
      {
         currentMomentum_30mMax = momentumValue;
      }
   }


      for( i=limit; i>=0; i--)

      MOMENTUM_Buffer[i]=((momentumNow - currentMomentum_30mMin)/(currentMomentum_30mMax - currentMomentum_30mMin))*100;

   return(0);
  }
//+------------------------------------------------------------------+
- Free trading apps
- Over 8,000 signals for copying
- Economic news for exploring financial markets
You agree to website policy and terms of use

Hi all,
I have been looking for a normalised version of the momentum indicator and cannot find exactly what I'm after.
I am now looking into changing the momentum indicator to display values from 0-100 (is this called normalised?) like RSI. Can anyone give me some example code of what would needed to be done to make the momentum indicator show values inside 0-100? Any hints would be appreciated.